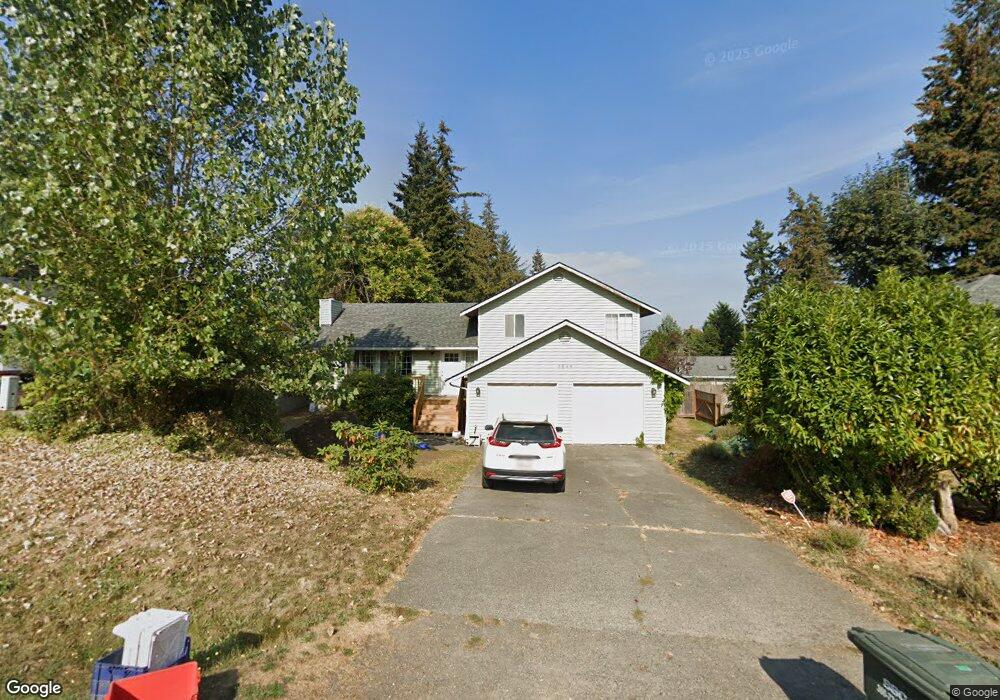
3844 Spring Coulee Rd Bellingham, WA 98226
Estimated Value: $708,907 - $763,000
4
Beds
3
Baths
1,820
Sq Ft
$407/Sq Ft
Est. Value
About This Home
This home is located at 3844 Spring Coulee Rd, Bellingham, WA 98226 and is currently estimated at $741,227, approximately $407 per square foot. 3844 Spring Coulee Rd is a home located in Whatcom County with nearby schools including Silver Beach Elementary School, Whatcom Middle School, and Squalicum High School.
Ownership History
Date
Name
Owned For
Owner Type
Purchase Details
Closed on
Feb 15, 2012
Sold by
Neevel James and Neevel Tami
Bought by
Enegren Sean E and Enegren Lindsay A
Current Estimated Value
Home Financials for this Owner
Home Financials are based on the most recent Mortgage that was taken out on this home.
Original Mortgage
$180,000
Outstanding Balance
$123,141
Interest Rate
3.86%
Mortgage Type
VA
Estimated Equity
$618,086
Purchase Details
Closed on
Feb 24, 2006
Sold by
Neevel Tami M
Bought by
Neevel James
Home Financials for this Owner
Home Financials are based on the most recent Mortgage that was taken out on this home.
Original Mortgage
$191,300
Interest Rate
5.35%
Mortgage Type
Fannie Mae Freddie Mac
Purchase Details
Closed on
Jan 14, 2000
Sold by
Witter Kenneth R and Witter Suzanne E
Bought by
Johnson William T and Johnson Lynda
Create a Home Valuation Report for This Property
The Home Valuation Report is an in-depth analysis detailing your home's value as well as a comparison with similar homes in the area
Home Values in the Area
Average Home Value in this Area
Purchase History
| Date | Buyer | Sale Price | Title Company |
|---|---|---|---|
| Enegren Sean E | $180,280 | Stewart Title Company | |
| Neevel James | -- | Whatcom Land Title | |
| Neevel James | $286,780 | Whatcom Land Title | |
| Johnson William T | -- | Chicago Title Insurance Co |
Source: Public Records
Mortgage History
| Date | Status | Borrower | Loan Amount |
|---|---|---|---|
| Open | Enegren Sean E | $180,000 | |
| Previous Owner | Neevel James | $191,300 | |
| Previous Owner | Neevel James | $50,000 |
Source: Public Records
Tax History Compared to Growth
Tax History
| Year | Tax Paid | Tax Assessment Tax Assessment Total Assessment is a certain percentage of the fair market value that is determined by local assessors to be the total taxable value of land and additions on the property. | Land | Improvement |
|---|---|---|---|---|
| 2024 | $5,278 | $600,323 | $213,840 | $386,483 |
| 2023 | $5,278 | $626,726 | $223,245 | $403,481 |
| 2022 | $4,183 | $509,533 | $181,500 | $328,033 |
| 2021 | $4,262 | $421,102 | $150,000 | $271,102 |
| 2020 | $4,158 | $403,404 | $132,405 | $270,999 |
| 2019 | $3,702 | $376,900 | $123,803 | $253,097 |
| 2018 | $3,838 | $338,054 | $111,053 | $227,001 |
| 2017 | $3,342 | $299,113 | $98,260 | $200,853 |
| 2016 | $3,087 | $271,832 | $89,420 | $182,412 |
| 2015 | $3,142 | $258,974 | $85,000 | $173,974 |
| 2014 | -- | $256,305 | $82,560 | $173,745 |
| 2013 | -- | $245,432 | $80,000 | $165,432 |
Source: Public Records
Map
Nearby Homes
- 1379 Northwood Ct
- 1314 Welling Rd
- 1430 Welling Rd
- 3713 Bristol St
- 3785 Greenville Place
- 3709 Bristol St
- 3527 Sussex Dr
- 1368 Roma Rd
- 4055 Springland Ct
- 3159 Chandler Pkwy
- 3155 Chandler Pkwy
- 3153 Chandler Pkwy
- 3606 Tree Farm Ct
- 3010 E Sunset Dr
- 3001 E Sunset Dr
- 3871 Cindy Ln
- 3715 E Sunset Dr
- 1580 Hillsdale Rd
- 3817 E Sunset Dr
- 4431 Alice St
- 3838 Spring Coulee Rd
- 3850 Spring Coulee Rd
- 3814 Magrath Rd
- 1327 Pincher Ct
- 3807 Pincher St
- 1323 Pincher Ct
- 3818 Magrath Rd
- 3843 Spring Coulee Rd
- 3849 Spring Coulee Rd
- 3815 Pincher St
- 3835 Spring Coulee Rd
- 3824 Magrath Rd
- 3821 Pincher St
- 3792 Magrath Rd
- 3813 Magrath Rd
- 3775 Pincher St
- 3801 Magrath Rd
- 3828 Magrath Rd
- 1328 Pincher Ct