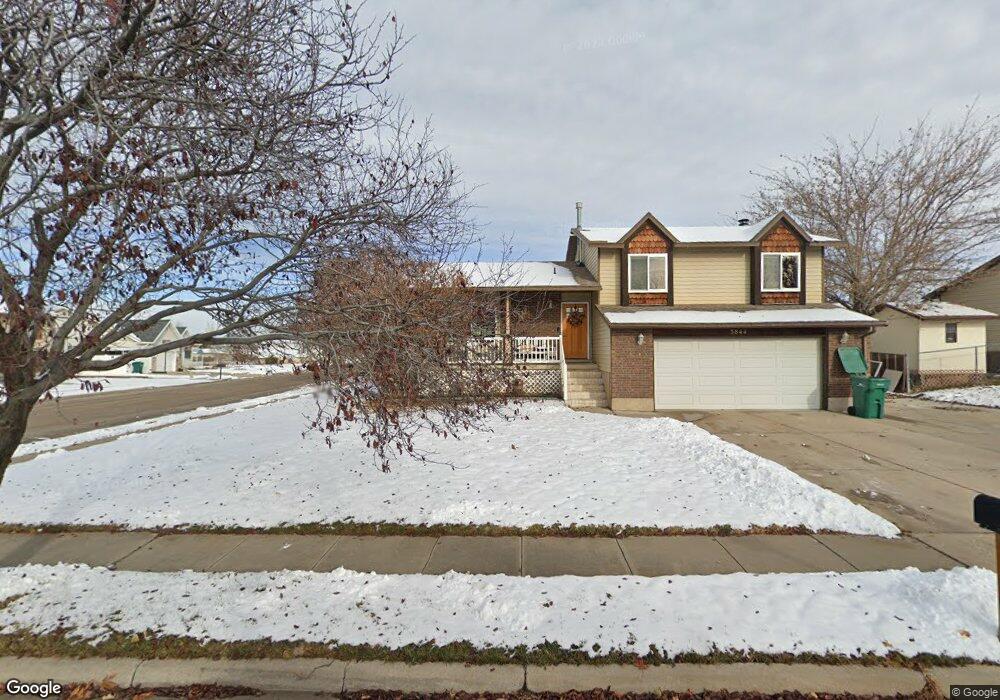
Estimated Value: $449,225 - $501,000
3
Beds
2
Baths
1,726
Sq Ft
$273/Sq Ft
Est. Value
About This Home
This home is located at 3844 W 5750 S, Roy, UT 84067 and is currently estimated at $471,556, approximately $273 per square foot. 3844 W 5750 S is a home located in Weber County with nearby schools including Midland School, Roy Junior High School, and Roy High School.
Ownership History
Date
Name
Owned For
Owner Type
Purchase Details
Closed on
Nov 30, 2022
Sold by
Hanson Adam G
Bought by
Gunnar And Teddie Hanson Family Irrevocable T
Current Estimated Value
Purchase Details
Closed on
Nov 8, 2002
Sold by
Hanson Adam G and Hanson Teddie D
Bought by
Hanson Adam G and Hanson Teddie D
Home Financials for this Owner
Home Financials are based on the most recent Mortgage that was taken out on this home.
Original Mortgage
$125,900
Interest Rate
5.89%
Purchase Details
Closed on
Nov 20, 2000
Sold by
Hanson Adam G
Bought by
Hanson Adam G and Clark Teddie
Purchase Details
Closed on
Nov 10, 2000
Sold by
Christensen Teddie Dee Clark and Clark Teddie Dee
Bought by
Hanson Adam G
Purchase Details
Closed on
Aug 27, 1999
Sold by
Christensen Thomas Lee
Bought by
Christensen Teddie Dee Clark and Clark Teddie Dee
Create a Home Valuation Report for This Property
The Home Valuation Report is an in-depth analysis detailing your home's value as well as a comparison with similar homes in the area
Home Values in the Area
Average Home Value in this Area
Purchase History
| Date | Buyer | Sale Price | Title Company |
|---|---|---|---|
| Gunnar And Teddie Hanson Family Irrevocable T | -- | -- | |
| Hanson Adam G | -- | Associated Title | |
| Hanson Adam G | -- | Mountain View Title | |
| Hanson Adam G | -- | Mountainview Title | |
| Christensen Teddie Dee Clark | -- | -- |
Source: Public Records
Mortgage History
| Date | Status | Borrower | Loan Amount |
|---|---|---|---|
| Previous Owner | Hanson Adam G | $125,900 | |
| Closed | Hanson Adam G | $10,000 |
Source: Public Records
Tax History Compared to Growth
Tax History
| Year | Tax Paid | Tax Assessment Tax Assessment Total Assessment is a certain percentage of the fair market value that is determined by local assessors to be the total taxable value of land and additions on the property. | Land | Improvement |
|---|---|---|---|---|
| 2025 | $2,758 | $460,700 | $145,004 | $315,696 |
| 2024 | $2,691 | $249,149 | $79,752 | $169,397 |
| 2023 | $2,812 | $250,800 | $74,166 | $176,634 |
| 2022 | $2,529 | $240,900 | $60,501 | $180,399 |
| 2021 | $2,156 | $343,000 | $79,963 | $263,037 |
| 2020 | $2,066 | $284,000 | $79,963 | $204,037 |
| 2019 | $1,967 | $275,000 | $49,906 | $225,094 |
| 2018 | $1,782 | $236,000 | $46,982 | $189,018 |
| 2017 | $1,612 | $202,000 | $46,982 | $155,018 |
| 2016 | $1,546 | $104,732 | $23,077 | $81,655 |
| 2015 | $1,358 | $94,492 | $23,077 | $71,415 |
| 2014 | $1,370 | $94,492 | $23,077 | $71,415 |
Source: Public Records
Map
Nearby Homes