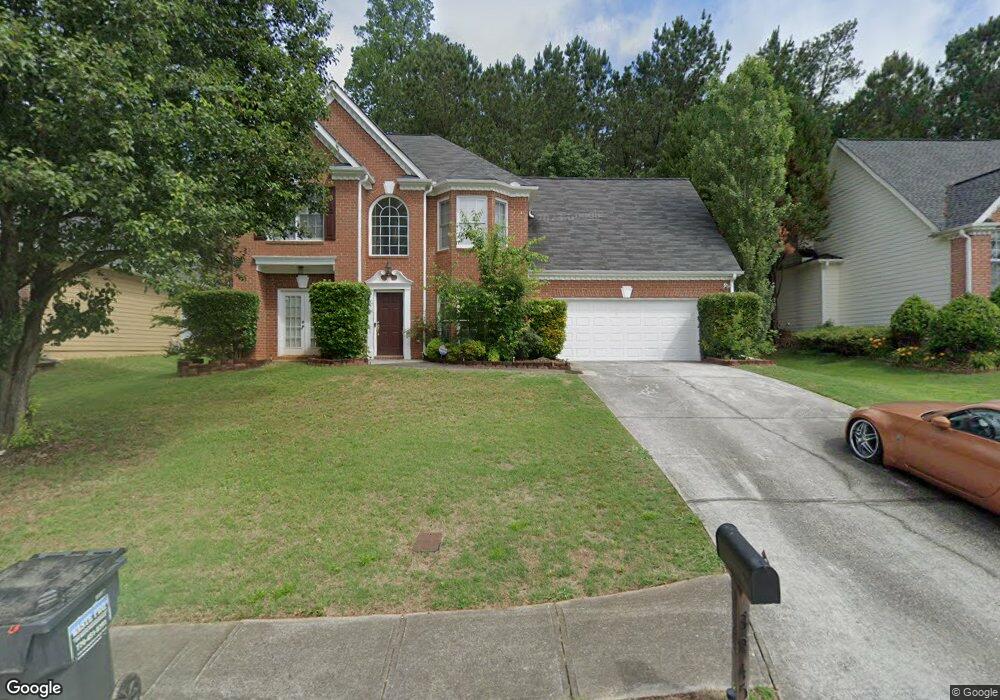
3845 Colonial Trail SW Unit 2 Lilburn, GA 30047
Estimated Value: $424,967 - $454,000
4
Beds
3
Baths
2,082
Sq Ft
$211/Sq Ft
Est. Value
About This Home
This home is located at 3845 Colonial Trail SW Unit 2, Lilburn, GA 30047 and is currently estimated at $439,242, approximately $210 per square foot. 3845 Colonial Trail SW Unit 2 is a home located in Gwinnett County with nearby schools including Head Elementary School, Five Forks Middle School, and Brookwood High School.
Ownership History
Date
Name
Owned For
Owner Type
Purchase Details
Closed on
Aug 12, 2019
Sold by
Collier Tydrecious A
Bought by
Collier Tydrecious A and Collier Simone A
Current Estimated Value
Home Financials for this Owner
Home Financials are based on the most recent Mortgage that was taken out on this home.
Original Mortgage
$186,609
Outstanding Balance
$167,274
Interest Rate
5.12%
Mortgage Type
FHA
Estimated Equity
$271,968
Purchase Details
Closed on
May 4, 2010
Sold by
Collier Katrina
Bought by
Collier Tydrecious
Purchase Details
Closed on
Aug 24, 1998
Sold by
Brookwood Homes Llc
Bought by
Collier Tydrec Lous
Home Financials for this Owner
Home Financials are based on the most recent Mortgage that was taken out on this home.
Original Mortgage
$152,900
Interest Rate
8.99%
Mortgage Type
New Conventional
Create a Home Valuation Report for This Property
The Home Valuation Report is an in-depth analysis detailing your home's value as well as a comparison with similar homes in the area
Home Values in the Area
Average Home Value in this Area
Purchase History
| Date | Buyer | Sale Price | Title Company |
|---|---|---|---|
| Collier Tydrecious A | -- | -- | |
| Collier Tydrecious | -- | -- | |
| Collier Tydrec Lous | $169,900 | -- |
Source: Public Records
Mortgage History
| Date | Status | Borrower | Loan Amount |
|---|---|---|---|
| Open | Collier Tydrecious A | $186,609 | |
| Previous Owner | Collier Tydrec Lous | $152,900 |
Source: Public Records
Tax History Compared to Growth
Tax History
| Year | Tax Paid | Tax Assessment Tax Assessment Total Assessment is a certain percentage of the fair market value that is determined by local assessors to be the total taxable value of land and additions on the property. | Land | Improvement |
|---|---|---|---|---|
| 2025 | $4,301 | $160,280 | $36,000 | $124,280 |
| 2024 | $4,308 | $154,080 | $36,000 | $118,080 |
| 2023 | $4,308 | $121,280 | $32,000 | $89,280 |
| 2022 | $3,591 | $121,280 | $32,000 | $89,280 |
| 2021 | $3,134 | $97,040 | $20,400 | $76,640 |
| 2020 | $3,156 | $97,040 | $20,400 | $76,640 |
| 2019 | $475 | $97,040 | $20,400 | $76,640 |
| 2018 | $2,598 | $75,080 | $18,400 | $56,680 |
| 2016 | $2,620 | $75,080 | $18,400 | $56,680 |
| 2015 | $2,405 | $64,440 | $9,200 | $55,240 |
| 2014 | -- | $64,440 | $9,200 | $55,240 |
Source: Public Records
Map
Nearby Homes
- 1315 Killian Shoals Way SW
- 3846 Teresa Terrace SW
- 1043 Wash Lee Dr SW
- 1394 Rustlewood Ct SW
- 978 Gwens Trail SW
- 1102 Timber Glen Ct SW
- 1093 Hasty Ct SW
- 1535 Pathfinder Way SW Unit 1
- 4449 Amberleaf Walk
- 4070 Runnymede Dr SW
- 4327 Saint Michaels Dr SW
- 1011 Guys Ct SW
- 1640 Killian Hill Rd SW
- 4271 Weston Dr SW
- 3868 Buckland Dr SW
- 772 Brookwood Terrace SW
- 3663 Stonelake Ct SW Unit 1
- 3855 Colonian Trail
- 3835 Colonial Trail SW
- 3855 Colonial Trail SW
- 3825 Colonial Trail SW Unit 2
- 3865 Colonial Trail SW Unit 14
- 3865 Colonial Trail SW
- 3840 Colonial Trail SW
- 3850 Colonial Trail SW Unit 2
- 3820 Colonial Trail SW
- 3690 Graham Way SW
- 3860 Colonial Trail SW Unit 2
- 3815 Colonial Trail SW
- 3875 Colonial Trail SW
- 3680 Graham Way SW
- 3870 Colonial Trail SW
- 3800 Colonial Trail SW
- 3885 Colonial Trail SW
- 3805 Colonial Trail SW
- 1253 Killian Knoll Cir SW Unit 2
- 1268 Killian Knoll Cir SW