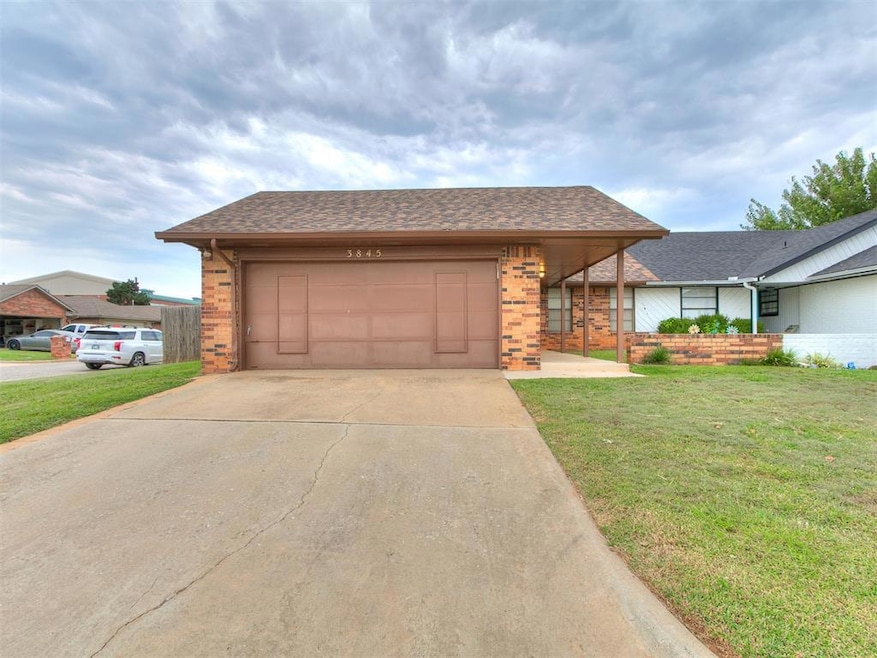


3845 Southwind Ave Oklahoma City, OK 73179
Winds West NeighborhoodEstimated payment $970/month
Highlights
- Traditional Architecture
- 2 Car Attached Garage
- 1-Story Property
- Covered Patio or Porch
- Interior Lot
- Central Heating and Cooling System
About This Home
Meticulously maintained, charming home awaits its new owner! This home would be ideal for first-time home buyers or investors wanting to add to their portfolio. Primary bedroom has its own en-suite bathroom. Secondary bedroom is large enough for a king-size bed.Additional full-size bathroom across the hall. Living room has a cozy fireplace and opens up to dining area. Kitchen includes a breakfast bar and gas stove. Natural light from full size sliding doors, leads to the patio area and large backyard space that forms the corner lot. Move-in ready! Welcome home.
Townhouse Details
Home Type
- Townhome
Est. Annual Taxes
- $1,090
Year Built
- Built in 1983
Parking
- 2 Car Attached Garage
Home Design
- Traditional Architecture
- Slab Foundation
- Brick Frame
- Composition Roof
Interior Spaces
- 1,214 Sq Ft Home
- 1-Story Property
- Wood Burning Fireplace
Bedrooms and Bathrooms
- 2 Bedrooms
- 2 Full Bathrooms
Schools
- Winds West Elementary School
- Western Heights Middle School
- Western Heights High School
Additional Features
- Covered Patio or Porch
- 4,900 Sq Ft Lot
- Central Heating and Cooling System
Listing and Financial Details
- Legal Lot and Block 012 / 011
Map
Home Values in the Area
Average Home Value in this Area
Tax History
| Year | Tax Paid | Tax Assessment Tax Assessment Total Assessment is a certain percentage of the fair market value that is determined by local assessors to be the total taxable value of land and additions on the property. | Land | Improvement |
|---|---|---|---|---|
| 2024 | $1,090 | $10,687 | $1,669 | $9,018 |
| 2023 | $1,090 | $10,375 | $1,586 | $8,789 |
| 2022 | $1,068 | $10,073 | $2,082 | $7,991 |
| 2021 | $1,060 | $9,779 | $1,943 | $7,836 |
| 2020 | $994 | $9,495 | $1,986 | $7,509 |
| 2019 | $973 | $9,219 | $2,047 | $7,172 |
| 2018 | $948 | $8,951 | $0 | $0 |
| 2017 | $914 | $8,689 | $1,987 | $6,702 |
| 2016 | $894 | $8,593 | $1,987 | $6,606 |
| 2015 | $912 | $8,683 | $1,987 | $6,696 |
| 2014 | $921 | $8,815 | $1,987 | $6,828 |
Property History
| Date | Event | Price | Change | Sq Ft Price |
|---|---|---|---|---|
| 09/11/2025 09/11/25 | For Sale | $165,000 | -- | $136 / Sq Ft |
Purchase History
| Date | Type | Sale Price | Title Company |
|---|---|---|---|
| Interfamily Deed Transfer | -- | None Available | |
| Warranty Deed | $50,000 | Capitol Abstract & Title Co | |
| Legal Action Court Order | $50,000 | -- |
Mortgage History
| Date | Status | Loan Amount | Loan Type |
|---|---|---|---|
| Open | $50,067 | FHA |
Source: MLSOK
MLS Number: 1190640
APN: 120663190
Disclaimer: Certain information contained herein is derived from information provided by parties other than Homes.com. All information provided is deemed reliable, but is not guaranteed to be accurate and should be independently verified.
![]() IDX information is provided exclusively for personal, non-commercial use, and may not be used for any purpose other than to identify prospective properties consumers may be interested in purchasing.
IDX information is provided exclusively for personal, non-commercial use, and may not be used for any purpose other than to identify prospective properties consumers may be interested in purchasing.
Information is deemed reliable but not guaranteed.
This information is not verified for authenticity or accuracy, is not guaranteed and may not reflect all real estate activity in the market.
Copyright 2025 MLSOK, Inc. All rights reserved.
- 3841 Southwind Ave
- 3800 Southwind Ct
- 3744 Windswest Ct
- 3716 Windrun Place
- 8508 SW 36th St
- 4409 Hunterfield Ave
- 4008 Idylbreeze Dr
- 8612 SW 36th Terrace
- 4404 Idyl Breeze Dr
- 8520 SW 44th Ct
- 8701 SW 37th St
- 4420 Idyl Breeze Dr
- 4405 Idyl Breeze Dr
- 8709 SW 36 Terrace
- 4704 Caleb St
- 4017 Wind Haven Dr
- 8616 SW 45th Terrace
- 8808 SW 41 St
- 9320 SW 34th St
- 8813 SW 45th St
- 3813 Southwind Ave
- 3700 Windscape Ave
- 4300 Windgate Rd W
- 4305 Windgate Rd W
- 4512 Rylee Dr
- 4405 Windgate Rd W
- 8722 SW 40th Terrace
- 8811 SW 45th St
- 8520 SW 49th Cir
- 4608 Crystal Clear Ln
- 9028 SW 46th St
- 9325 SW 44th Terrace
- 4340 Siena Ridge Blvd
- 4309 Umbria Rd
- 9332 SW 33rd Place
- 9333 SW 33rd Place
- 4200 Umbria Rd
- 5717 Gadwall Rd
- 2821 Fennel Rd
- 8709 SW 66th Place
