
Seller's Agent in 2025
Todd Ninneman
RE/MAX
(602) 677-4653
51 in this area
81 Total Sales
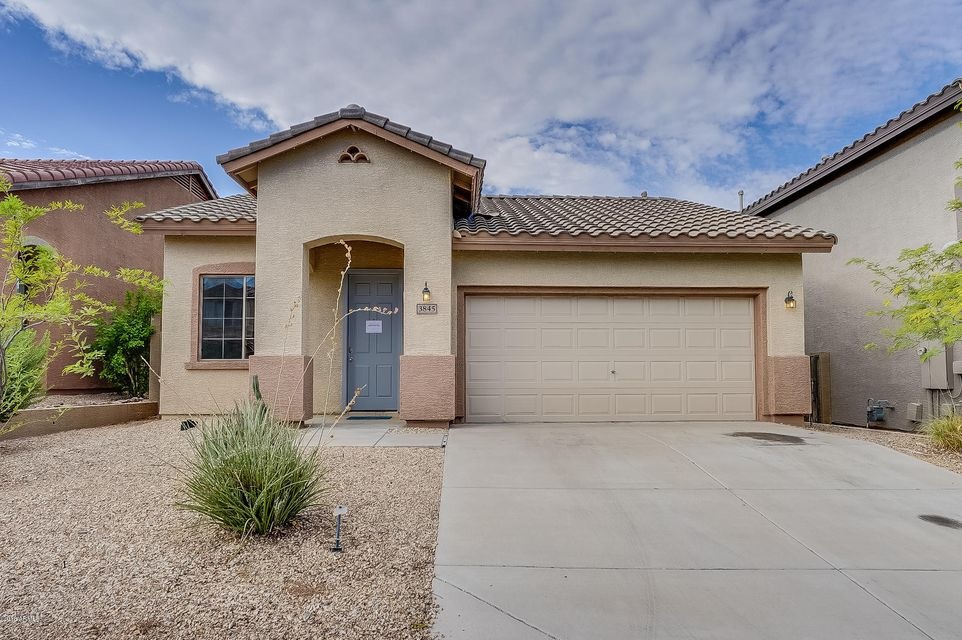
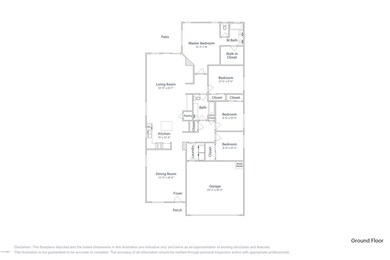
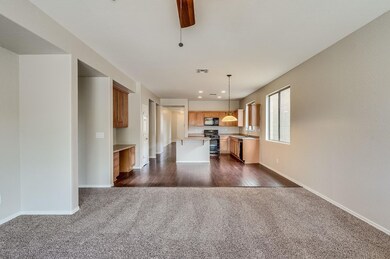
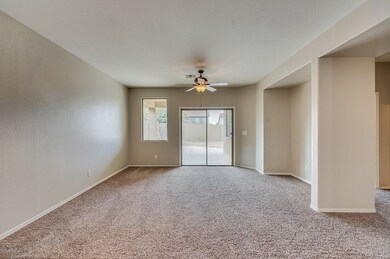
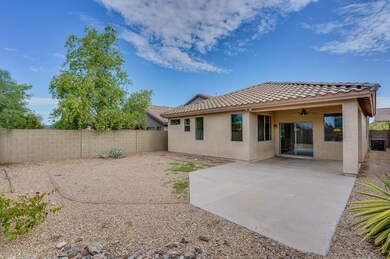
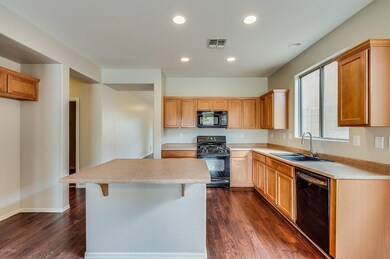
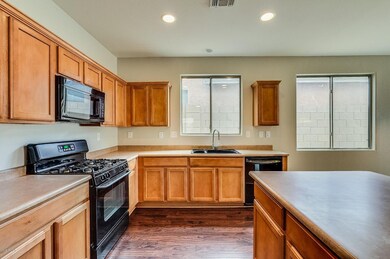
This home been recently freshened up with new paint and updated flooring. Home is ready for new buyer! Notice new carpets at this Phoenix home! Pass through the laminate living room to reach the kitchen, an island with breakfast bar and a secretary's nook. Master suite amenities include a walk-in closet and a dual sink vanity in the en suite. Covered and extended patio out back. Yard awaits landscaping! Minutes from The Outlets at Anthem and I-17 access.
Home comes with a 30-day satisfaction guarantee. Terms and conditions apply.
Last Agent to Sell the Property
LPT Realty, LLC License #SA661001000 Listed on: 12/21/2017
| Date | Type | Sale Price | Title Company |
|---|---|---|---|
| Warranty Deed | $460,000 | Navi Title Agency | |
| Warranty Deed | $266,500 | Os National Llc | |
| Warranty Deed | $259,200 | None Available | |
| Warranty Deed | $214,000 | Security Title Agency Inc | |
| Interfamily Deed Transfer | -- | American Title Service Agenc | |
| Warranty Deed | $170,000 | American Title Service Agenc | |
| Warranty Deed | $180,000 | Grand Canyon Title Agency In | |
| Interfamily Deed Transfer | -- | Grand Canyon Title Agency In | |
| Corporate Deed | $267,165 | Sun Title Agency Co | |
| Corporate Deed | -- | Sun Title Agency Co |
| Date | Status | Loan Amount | Loan Type |
|---|---|---|---|
| Open | $230,000 | New Conventional | |
| Previous Owner | $275,370 | VA | |
| Previous Owner | $272,229 | VA | |
| Previous Owner | $150,000,000 | Construction | |
| Previous Owner | $215,306 | New Conventional | |
| Previous Owner | $166,920 | FHA | |
| Previous Owner | $188,324 | VA | |
| Previous Owner | $183,850 | VA | |
| Previous Owner | $183,850 | VA | |
| Previous Owner | $213,732 | New Conventional | |
| Closed | $53,400 | No Value Available |
| Date | Event | Price | Change | Sq Ft Price |
|---|---|---|---|---|
| 08/19/2025 08/19/25 | Sold | $460,000 | 0.0% | $252 / Sq Ft |
| 07/25/2025 07/25/25 | Pending | -- | -- | -- |
| 06/23/2025 06/23/25 | Price Changed | $460,000 | -5.2% | $252 / Sq Ft |
| 05/18/2025 05/18/25 | For Sale | $485,000 | 0.0% | $265 / Sq Ft |
| 06/24/2023 06/24/23 | Rented | $2,100 | -99.2% | -- |
| 05/14/2023 05/14/23 | Under Contract | -- | -- | -- |
| 12/14/2018 12/14/18 | Sold | $266,500 | +4.1% | $146 / Sq Ft |
| 11/02/2018 11/02/18 | Pending | -- | -- | -- |
| 10/25/2018 10/25/18 | Price Changed | $256,000 | -0.8% | $140 / Sq Ft |
| 10/18/2018 10/18/18 | Price Changed | $258,000 | -0.8% | $141 / Sq Ft |
| 09/20/2018 09/20/18 | Price Changed | $260,000 | -1.1% | $142 / Sq Ft |
| 09/06/2018 09/06/18 | Price Changed | $263,000 | -0.8% | $144 / Sq Ft |
| 08/17/2018 08/17/18 | Price Changed | $265,000 | -0.7% | $145 / Sq Ft |
| 08/08/2018 08/08/18 | For Sale | $267,000 | +0.2% | $146 / Sq Ft |
| 07/29/2018 07/29/18 | Off Market | $266,500 | -- | -- |
| 06/21/2018 06/21/18 | Price Changed | $267,000 | -1.1% | $146 / Sq Ft |
| 04/26/2018 04/26/18 | Price Changed | $270,000 | -0.4% | $148 / Sq Ft |
| 04/19/2018 04/19/18 | Price Changed | $271,000 | -0.4% | $148 / Sq Ft |
| 04/05/2018 04/05/18 | Price Changed | $272,000 | -0.7% | $149 / Sq Ft |
| 03/29/2018 03/29/18 | Price Changed | $274,000 | -0.4% | $150 / Sq Ft |
| 03/15/2018 03/15/18 | Price Changed | $275,000 | -0.4% | $151 / Sq Ft |
| 03/01/2018 03/01/18 | Price Changed | $276,000 | -0.4% | $151 / Sq Ft |
| 02/16/2018 02/16/18 | Price Changed | $277,000 | -0.4% | $152 / Sq Ft |
| 02/08/2018 02/08/18 | Price Changed | $278,000 | -0.4% | $152 / Sq Ft |
| 01/26/2018 01/26/18 | Price Changed | $279,000 | -0.4% | $153 / Sq Ft |
| 01/12/2018 01/12/18 | Price Changed | $280,000 | -0.4% | $153 / Sq Ft |
| 01/04/2018 01/04/18 | Price Changed | $281,000 | -0.4% | $154 / Sq Ft |
| 12/21/2017 12/21/17 | For Sale | $282,000 | +33.6% | $154 / Sq Ft |
| 07/01/2015 07/01/15 | Sold | $211,000 | 0.0% | $115 / Sq Ft |
| 05/22/2015 05/22/15 | Pending | -- | -- | -- |
| 05/01/2015 05/01/15 | Price Changed | $210,900 | -2.3% | $115 / Sq Ft |
| 04/08/2015 04/08/15 | Price Changed | $215,900 | -1.8% | $118 / Sq Ft |
| 02/24/2015 02/24/15 | For Sale | $219,900 | +29.4% | $120 / Sq Ft |
| 11/27/2012 11/27/12 | Sold | $170,000 | +9.7% | $93 / Sq Ft |
| 05/23/2012 05/23/12 | Pending | -- | -- | -- |
| 05/23/2012 05/23/12 | For Sale | $155,000 | -8.8% | $85 / Sq Ft |
| 05/05/2012 05/05/12 | Off Market | $170,000 | -- | -- |
| 04/27/2012 04/27/12 | For Sale | $155,000 | -- | $85 / Sq Ft |
| Year | Tax Paid | Tax Assessment Tax Assessment Total Assessment is a certain percentage of the fair market value that is determined by local assessors to be the total taxable value of land and additions on the property. | Land | Improvement |
|---|---|---|---|---|
| 2025 | $2,062 | $22,012 | -- | -- |
| 2024 | $2,223 | $20,964 | -- | -- |
| 2023 | $2,223 | $33,870 | $6,770 | $27,100 |
| 2022 | $2,125 | $24,450 | $4,890 | $19,560 |
| 2021 | $2,188 | $22,610 | $4,520 | $18,090 |
| 2020 | $2,140 | $21,060 | $4,210 | $16,850 |
| 2019 | $2,099 | $19,900 | $3,980 | $15,920 |
| 2018 | $2,323 | $18,360 | $3,670 | $14,690 |
| 2017 | $1,993 | $17,000 | $3,400 | $13,600 |
| 2016 | $1,709 | $16,330 | $3,260 | $13,070 |
| 2015 | $1,658 | $15,310 | $3,060 | $12,250 |
Seller's Agent in 2025
Todd Ninneman
RE/MAX
(602) 677-4653
51 in this area
81 Total Sales
D
Seller Co-Listing Agent in 2025
Darren Fletcher
RE/MAX
(775) 544-3548
7 in this area
10 Total Sales
G
Buyer's Agent in 2025
Graham Murphy
My Home Group Real Estate
(480) 737-3030
1 in this area
1 Total Sale
Seller's Agent in 2023
Debbie Zappala
Fathom Realty Elite
(602) 292-2725
40 in this area
92 Total Sales
Seller Co-Listing Agent in 2023
Todd Zappala
Fathom Realty Elite
(602) 558-9593
34 in this area
72 Total Sales
D
Buyer's Agent in 2023
Deborah Zappala
Sam Tyler Realty, LLC
Source: Arizona Regional Multiple Listing Service (ARMLS)
MLS Number: 5700804
APN: 203-03-746
Disclaimer: Certain information contained herein is derived from information provided by parties other than Homes.com. All information provided is deemed reliable, but is not guaranteed to be accurate and should be independently verified.
![]() All information should be verified by the recipient and none is guaranteed as accurate by ARMLS
All information should be verified by the recipient and none is guaranteed as accurate by ARMLS
Listing Information presented by local MLS brokerage: Ten-X, local REALTOR®- Arlene Richardson - (888)-952-6393