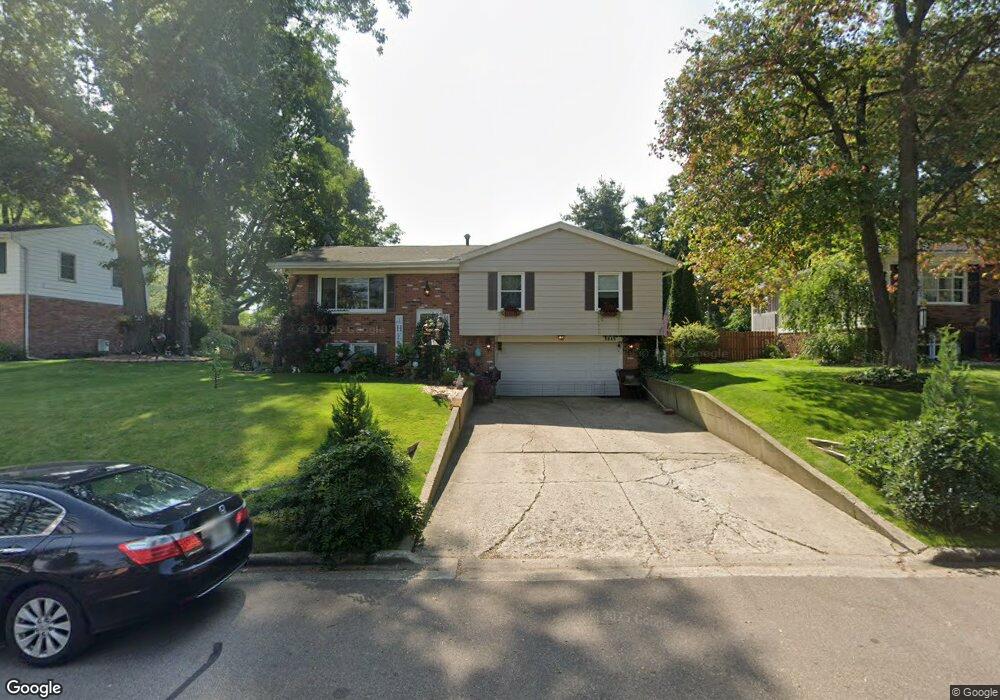
3845 Westchester Blvd Unit WESTCHESTER Jackson, MI 49203
Estimated Value: $252,000 - $275,000
3
Beds
2
Baths
1,178
Sq Ft
$225/Sq Ft
Est. Value
About This Home
This home is located at 3845 Westchester Blvd Unit WESTCHESTER, Jackson, MI 49203 and is currently estimated at $265,394, approximately $225 per square foot. 3845 Westchester Blvd Unit WESTCHESTER is a home located in Jackson County with nearby schools including Hunt Elementary School, Middle School at Parkside, and Jackson High School.
Ownership History
Date
Name
Owned For
Owner Type
Purchase Details
Closed on
Nov 1, 2019
Sold by
Fischer Christopher C
Bought by
Rhode Jeffrey D and Rhode Alexis A
Current Estimated Value
Home Financials for this Owner
Home Financials are based on the most recent Mortgage that was taken out on this home.
Original Mortgage
$150,160
Outstanding Balance
$132,102
Interest Rate
3.6%
Mortgage Type
VA
Estimated Equity
$133,292
Purchase Details
Closed on
Jun 28, 2010
Sold by
Chase Home Finance Llc
Bought by
The Secretary Of Housing & Urban Develop
Purchase Details
Closed on
May 27, 2005
Sold by
Hong James R and Hong Cynthia R
Bought by
Flores Da Silva Marcos Flores and Flores Da Silva Fay
Home Financials for this Owner
Home Financials are based on the most recent Mortgage that was taken out on this home.
Original Mortgage
$133,445
Interest Rate
5.91%
Mortgage Type
FHA
Create a Home Valuation Report for This Property
The Home Valuation Report is an in-depth analysis detailing your home's value as well as a comparison with similar homes in the area
Home Values in the Area
Average Home Value in this Area
Purchase History
| Date | Buyer | Sale Price | Title Company |
|---|---|---|---|
| Rhode Jeffrey D | $147,000 | None Available | |
| The Secretary Of Housing & Urban Develop | -- | None Available | |
| Flores Da Silva Marcos Flores | $134,500 | At |
Source: Public Records
Mortgage History
| Date | Status | Borrower | Loan Amount |
|---|---|---|---|
| Open | Rhode Jeffrey D | $150,160 | |
| Previous Owner | Flores Da Silva Marcos Flores | $133,445 |
Source: Public Records
Tax History Compared to Growth
Tax History
| Year | Tax Paid | Tax Assessment Tax Assessment Total Assessment is a certain percentage of the fair market value that is determined by local assessors to be the total taxable value of land and additions on the property. | Land | Improvement |
|---|---|---|---|---|
| 2025 | $2,835 | $123,900 | $0 | $0 |
| 2024 | $1,821 | $89,100 | $0 | $0 |
| 2023 | $1,753 | $81,500 | $0 | $0 |
| 2022 | $2,599 | $73,600 | $0 | $0 |
| 2021 | $2,565 | $71,900 | $0 | $0 |
| 2020 | $2,536 | $67,900 | $0 | $0 |
| 2019 | $2,731 | $55,700 | $0 | $0 |
| 2018 | $2,651 | $57,500 | $0 | $0 |
| 2017 | $2,276 | $57,100 | $0 | $0 |
| 2016 | $1,791 | $55,700 | $55,700 | $0 |
| 2015 | $2,180 | $48,500 | $48,500 | $0 |
| 2014 | $2,180 | $46,100 | $0 | $0 |
| 2013 | -- | $46,100 | $46,100 | $0 |
Source: Public Records
Map
Nearby Homes
- 564 Birchwood St
- 585 Robinson Rd
- 641 Robinson Rd
- 732 W Barrington Cir Unit 116
- 0 Evelyn St
- 745 W Barrington Cir Unit 92
- 824 W Barrington Cir Unit 28
- 850 E Barrington Cir Unit 18
- The Yorkshire Plan at Preserve at Magnolia Park
- The Yately Plan at Preserve at Magnolia Park
- The Winslow Plan at Preserve at Magnolia Park
- The Springfield Plan at Preserve at Magnolia Park
- The Natural Plan at Preserve at Magnolia Park
- The Middleton Plan at Preserve at Magnolia Park
- The Malden Plan at Preserve at Magnolia Park
- The Lancaster Plan at Preserve at Magnolia Park
- The Kettering Plan at Preserve at Magnolia Park
- The Kensington Plan at Preserve at Magnolia Park
- The Hartland Plan at Preserve at Magnolia Park
- The Hampshire Plan at Preserve at Magnolia Park
- 3845 Westchester Blvd
- 3841 Westchester Blvd
- 3849 Westchester Blvd
- 3837 Westchester Blvd
- 3853 Westchester Blvd
- 3848 Westchester Blvd
- 3844 Westchester Blvd
- 3833 Westchester Blvd
- 3852 Westchester Blvd
- 556 Birchwood St
- 3840 Westchester Blvd
- 560 Birchwood St
- 3856 Westchester Blvd
- 552 Birchwood St
- 3829 Westchester Blvd
- 571 Christopher Rd
- 3860 Westchester Blvd
- 3832 Westchester Blvd
- 568 Birchwood St
- 562 Christopher Rd