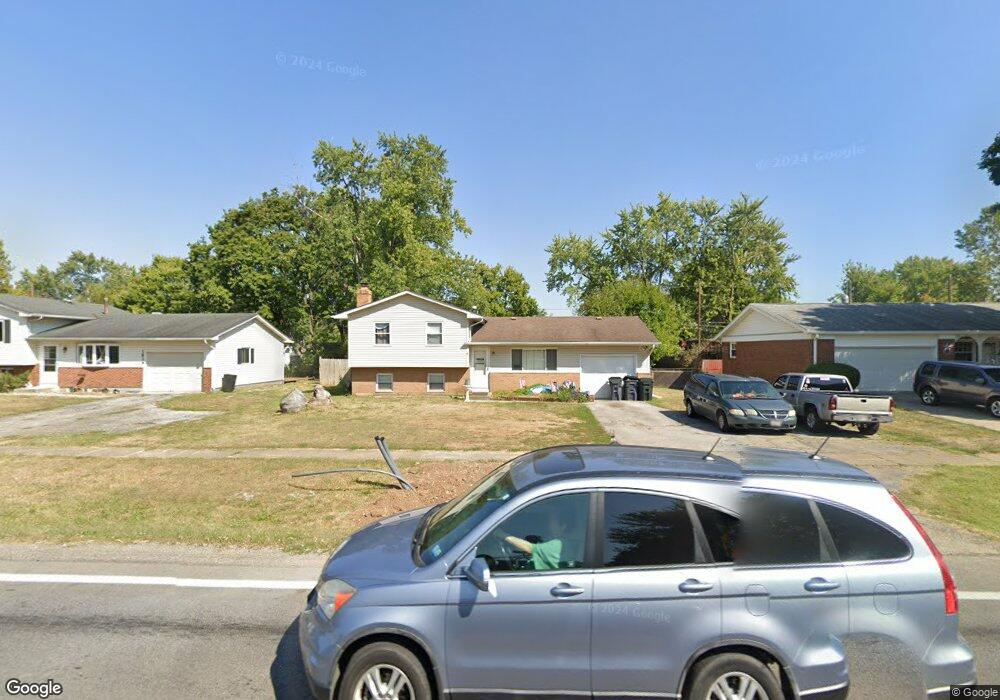
3846 Noe Bixby Rd Columbus, OH 43232
East Columbus-White Ash NeighborhoodEstimated Value: $214,102 - $248,000
3
Beds
3
Baths
1,448
Sq Ft
$159/Sq Ft
Est. Value
About This Home
This home is located at 3846 Noe Bixby Rd, Columbus, OH 43232 and is currently estimated at $230,276, approximately $159 per square foot. 3846 Noe Bixby Rd is a home located in Franklin County with nearby schools including Groveport Madison High School and Eastland Preparatory Academy.
Ownership History
Date
Name
Owned For
Owner Type
Purchase Details
Closed on
Jul 24, 2020
Sold by
Doorley Kevin and Doorley Kevin P
Bought by
Doorley Brothers Llc
Current Estimated Value
Purchase Details
Closed on
Jun 27, 2008
Sold by
Wells Fargo Bank Na
Bought by
Doorley Kevin
Home Financials for this Owner
Home Financials are based on the most recent Mortgage that was taken out on this home.
Original Mortgage
$48,000
Outstanding Balance
$31,013
Interest Rate
6.1%
Mortgage Type
Purchase Money Mortgage
Estimated Equity
$199,263
Purchase Details
Closed on
May 17, 2007
Sold by
Porter Arthur S and Porter Arthur Sylvester
Bought by
Wells Fargo Bank Na and Asset Backed Pass Through Certificates S
Purchase Details
Closed on
Jan 21, 2005
Sold by
Tupa Christian A
Bought by
Porter Arthur S
Home Financials for this Owner
Home Financials are based on the most recent Mortgage that was taken out on this home.
Original Mortgage
$103,500
Interest Rate
7.65%
Mortgage Type
Purchase Money Mortgage
Purchase Details
Closed on
Jan 24, 1996
Sold by
Faieta Gary P
Bought by
Christian A Tupa
Home Financials for this Owner
Home Financials are based on the most recent Mortgage that was taken out on this home.
Original Mortgage
$69,018
Interest Rate
7.19%
Mortgage Type
FHA
Purchase Details
Closed on
Oct 1, 1985
Purchase Details
Closed on
Oct 1, 1983
Create a Home Valuation Report for This Property
The Home Valuation Report is an in-depth analysis detailing your home's value as well as a comparison with similar homes in the area
Home Values in the Area
Average Home Value in this Area
Purchase History
| Date | Buyer | Sale Price | Title Company |
|---|---|---|---|
| Doorley Brothers Llc | -- | None Available | |
| Doorley Kevin | $60,000 | Nova Title Agency Inc | |
| Wells Fargo Bank Na | $68,000 | None Available | |
| Porter Arthur S | $115,000 | New Century | |
| Christian A Tupa | $77,500 | -- | |
| -- | $49,500 | -- | |
| -- | $38,000 | -- |
Source: Public Records
Mortgage History
| Date | Status | Borrower | Loan Amount |
|---|---|---|---|
| Open | Doorley Kevin | $48,000 | |
| Previous Owner | Porter Arthur S | $103,500 | |
| Previous Owner | Christian A Tupa | $69,018 |
Source: Public Records
Tax History Compared to Growth
Tax History
| Year | Tax Paid | Tax Assessment Tax Assessment Total Assessment is a certain percentage of the fair market value that is determined by local assessors to be the total taxable value of land and additions on the property. | Land | Improvement |
|---|---|---|---|---|
| 2024 | $3,252 | $65,980 | $15,680 | $50,300 |
| 2023 | $3,224 | $65,980 | $15,680 | $50,300 |
| 2022 | $2,210 | $35,980 | $8,190 | $27,790 |
| 2021 | $2,368 | $35,980 | $8,190 | $27,790 |
| 2020 | $2,224 | $35,980 | $8,190 | $27,790 |
| 2019 | $2,097 | $29,860 | $6,830 | $23,030 |
| 2018 | $2,110 | $29,860 | $6,830 | $23,030 |
| 2017 | $2,114 | $29,860 | $6,830 | $23,030 |
| 2016 | $2,092 | $26,810 | $4,620 | $22,190 |
| 2015 | $2,111 | $26,810 | $4,620 | $22,190 |
| 2014 | $1,989 | $26,810 | $4,620 | $22,190 |
| 2013 | $944 | $29,785 | $5,145 | $24,640 |
Source: Public Records
Map
Nearby Homes
- 3900 Noe Bixby Rd
- 5096 Fullerton Dr
- 4940 Brewster Dr
- 5145 Fullerton Dr
- 5004 Bentler Dr
- 5174 Fullerton Dr
- 3721 Aurelia Dr
- 3856 Crestfield Dr Unit 3856
- 5044 Albany Dr
- 5106 Harbor Blvd
- 3567 Wymore Place
- 4655 Glengate Dr
- 3739 Atkinson Rd
- 4106 Wiston Dr Unit 4106
- 3773 Clearwater Dr
- 3493 Tremaine Rd
- 3773 Tylor Dr
- 4344 Seahorse Ln Unit 4344
- 4496 Reinbeau Dr
- 4468 Reinbeau Dr
- 3834 Noe Bixby Rd
- 3858 Noe Bixby Rd
- 3849 Armada Rd
- 3855 Armada Rd
- 3822 Noe Bixby Rd
- 3837 Armada Rd
- 3867 Armada Rd
- 3870 Noe Bixby Rd
- 4978 Fullerton Dr
- 3827 Armada Rd
- 3810 Noe Bixby Rd
- 3819 Armada Rd
- 3857 Noe Bixby Rd
- 3833 Noe Bixby Rd
- 3840 Armada Rd
- 3811 Armada Rd
- 3800 Noe Bixby Rd
- 3878 Armada Rd
- 3867 Noe Bixby Rd
- 3828 Armada Rd