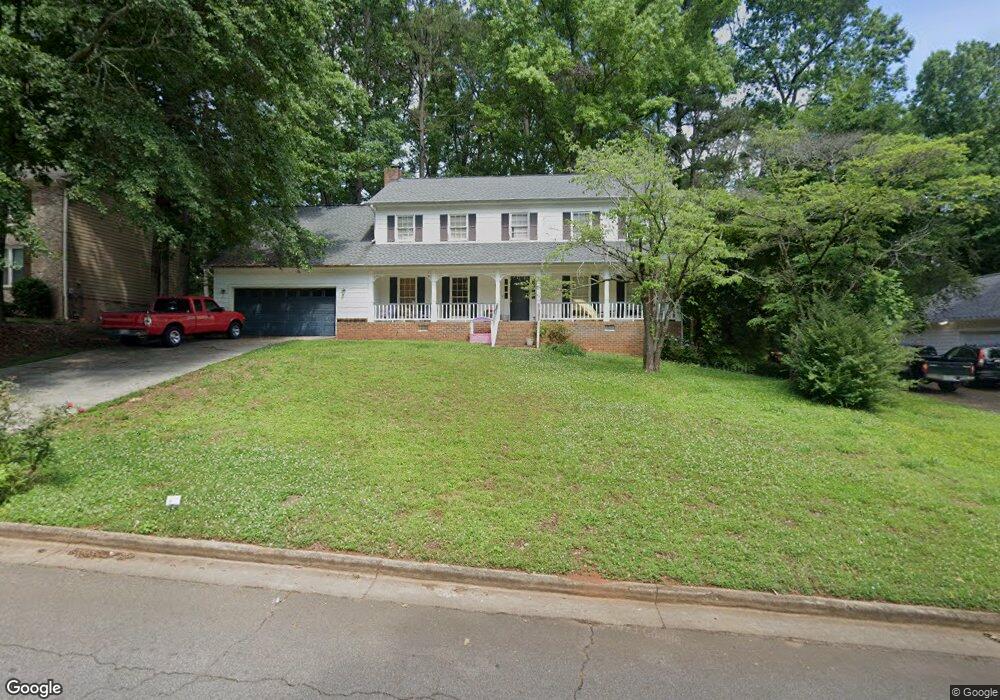
3849 Lee Ridge Way SW Lilburn, GA 30047
Estimated Value: $390,172 - $433,000
4
Beds
2
Baths
2,136
Sq Ft
$192/Sq Ft
Est. Value
About This Home
This home is located at 3849 Lee Ridge Way SW, Lilburn, GA 30047 and is currently estimated at $409,543, approximately $191 per square foot. 3849 Lee Ridge Way SW is a home located in Gwinnett County with nearby schools including Gwin Oaks Elementary School, Five Forks Middle School, and Brookwood High School.
Ownership History
Date
Name
Owned For
Owner Type
Purchase Details
Closed on
Jun 2, 2025
Sold by
Hardy Margaret A
Bought by
Hardy Margaret A and Stone Stephanie Renee
Current Estimated Value
Purchase Details
Closed on
Jan 25, 2002
Sold by
Dooley Bryan N and Dooley Kimela B
Bought by
Hardy Alvie L and Hardy Margaret A
Home Financials for this Owner
Home Financials are based on the most recent Mortgage that was taken out on this home.
Original Mortgage
$174,265
Interest Rate
7.12%
Mortgage Type
New Conventional
Purchase Details
Closed on
Mar 15, 1996
Sold by
Johnston Burleigh C Nancy
Bought by
Dooley Byron N Kimela B
Purchase Details
Closed on
Feb 24, 1994
Sold by
Edmondson W W Mitzi Ann
Bought by
Johnston Burleigh C Nancy
Home Financials for this Owner
Home Financials are based on the most recent Mortgage that was taken out on this home.
Original Mortgage
$132,800
Interest Rate
5.5%
Create a Home Valuation Report for This Property
The Home Valuation Report is an in-depth analysis detailing your home's value as well as a comparison with similar homes in the area
Home Values in the Area
Average Home Value in this Area
Purchase History
| Date | Buyer | Sale Price | Title Company |
|---|---|---|---|
| Hardy Margaret A | -- | -- | |
| Hardy Alvie L | $177,000 | -- | |
| Dooley Byron N Kimela B | $143,500 | -- | |
| Johnston Burleigh C Nancy | $139,900 | -- |
Source: Public Records
Mortgage History
| Date | Status | Borrower | Loan Amount |
|---|---|---|---|
| Previous Owner | Hardy Alvie L | $174,265 | |
| Previous Owner | Johnston Burleigh C Nancy | $132,800 | |
| Closed | Dooley Byron N Kimela B | $0 |
Source: Public Records
Tax History Compared to Growth
Tax History
| Year | Tax Paid | Tax Assessment Tax Assessment Total Assessment is a certain percentage of the fair market value that is determined by local assessors to be the total taxable value of land and additions on the property. | Land | Improvement |
|---|---|---|---|---|
| 2025 | $4,098 | $150,480 | $30,000 | $120,480 |
| 2024 | $4,138 | $146,040 | $30,000 | $116,040 |
| 2023 | $4,138 | $126,240 | $29,600 | $96,640 |
| 2022 | $3,583 | $120,880 | $29,600 | $91,280 |
| 2021 | $2,895 | $85,840 | $23,200 | $62,640 |
| 2020 | $2,914 | $85,840 | $23,200 | $62,640 |
| 2019 | $2,831 | $85,840 | $23,200 | $62,640 |
| 2018 | $2,832 | $85,840 | $23,200 | $62,640 |
| 2016 | $2,686 | $78,080 | $18,000 | $60,080 |
| 2015 | $2,365 | $63,120 | $12,800 | $50,320 |
| 2014 | $2,182 | $57,720 | $12,800 | $44,920 |
Source: Public Records
Map
Nearby Homes
- 3846 Teresa Terrace SW
- 978 Gwens Trail SW
- 1315 Killian Shoals Way SW
- 1011 Guys Ct SW
- 1043 Wash Lee Dr SW
- 924 Hazel Ct SW
- 1394 Rustlewood Ct SW
- 1293 Elk Terrace SW
- 5299 Noble Village Way
- 5099 Noble Village Way
- 1314 Elk Terrace SW
- 3321 Newburn St SW
- 3142 Preservation Cir
- 1102 Timber Glen Ct SW
- 834 Hickory Ridge Rd SW
- 1093 Hasty Ct SW
- 1221 Martin Nash Rd SW
- 1535 Pathfinder Way SW Unit 1
- 3839 Lee Ridge Way SW
- 3859 Lee Ridge Way SW
- 3836 Teresa Terrace SW
- 3869 Lee Ridge Way SW
- 0 Teresa Terrace SW Unit 7496733
- 0 Teresa Terrace SW Unit 3058816
- 3830 Teresa Terrace SW
- 1177 Gwens Trail SW
- 3848 Lee Ridge Way SW
- 3829 Lee Ridge Way SW
- 3858 Lee Ridge Way SW
- 1167 Gwens Trail SW
- 3838 Lee Ridge Way SW
- 0 Lee Ridge Way SW Unit 7466620
- 0 Lee Ridge Way SW Unit 8593859
- 0 Lee Ridge Way SW Unit 8565238
- 0 Lee Ridge Way SW Unit 7600574
- 0 Lee Ridge Way SW Unit 8747839
- 0 Lee Ridge Way SW Unit 8821965
- 0 Lee Ridge Way SW Unit 3115916