Estimated Value: $454,000 - $528,206
4
Beds
2
Baths
2,274
Sq Ft
$210/Sq Ft
Est. Value
About This Home
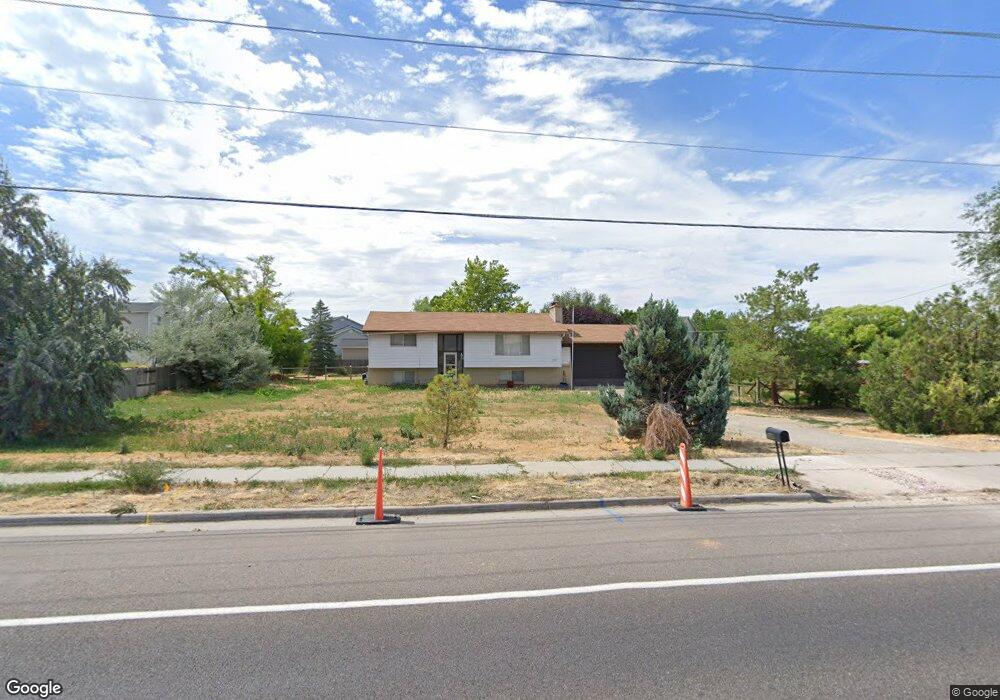
This home is located at 3849 W 5500 S, Roy, UT 84067 and is currently estimated at $477,552, approximately $210 per square foot. 3849 W 5500 S is a home located in Weber County with nearby schools including Freedom School, Roy Junior High School, and Roy High School.
Ownership History
Date
Name
Owned For
Owner Type
Purchase Details
Closed on
Dec 2, 2020
Sold by
Scheifl Dina Lee
Bought by
Scheifl Dina and The Dina Scheifl Trust
Current Estimated Value
Purchase Details
Closed on
Nov 5, 2013
Sold by
Scheifl Robert H
Bought by
Scheifl Dina L
Purchase Details
Closed on
Jun 8, 2005
Sold by
Harkema Marvin J and Harkema Sharon Luise
Bought by
Scheifl Robert H and Scheifl Dina L
Home Financials for this Owner
Home Financials are based on the most recent Mortgage that was taken out on this home.
Original Mortgage
$166,150
Outstanding Balance
$94,189
Interest Rate
7.12%
Mortgage Type
Fannie Mae Freddie Mac
Estimated Equity
$383,363
Purchase Details
Closed on
Jun 10, 1997
Sold by
Crane Steven H and Crane Angela M
Bought by
Harkema Marvin J and Harkema Sharon Luise
Home Financials for this Owner
Home Financials are based on the most recent Mortgage that was taken out on this home.
Original Mortgage
$112,000
Interest Rate
7.98%
Create a Home Valuation Report for This Property
The Home Valuation Report is an in-depth analysis detailing your home's value as well as a comparison with similar homes in the area
Home Values in the Area
Average Home Value in this Area
Purchase History
| Date | Buyer | Sale Price | Title Company |
|---|---|---|---|
| Scheifl Dina | -- | None Available | |
| Scheifl Dina L | -- | Us Titl Insurance Agency | |
| Scheifl Robert H | -- | First American Title | |
| Harkema Marvin J | -- | First American Title |
Source: Public Records
Mortgage History
| Date | Status | Borrower | Loan Amount |
|---|---|---|---|
| Open | Scheifl Robert H | $166,150 | |
| Previous Owner | Harkema Marvin J | $112,000 |
Source: Public Records
Tax History
| Year | Tax Paid | Tax Assessment Tax Assessment Total Assessment is a certain percentage of the fair market value that is determined by local assessors to be the total taxable value of land and additions on the property. | Land | Improvement |
|---|---|---|---|---|
| 2025 | $3,083 | $456,898 | $215,019 | $241,879 |
| 2024 | $3,017 | $253,572 | $118,260 | $135,312 |
| 2023 | $2,917 | $245,528 | $101,521 | $144,007 |
| 2022 | $3,074 | $258,501 | $75,858 | $182,643 |
| 2021 | $2,676 | $368,001 | $109,733 | $258,268 |
| 2020 | $2,381 | $308,001 | $109,733 | $198,268 |
| 2019 | $2,351 | $288,000 | $75,451 | $212,549 |
| 2018 | $2,394 | $279,999 | $72,627 | $207,372 |
| 2017 | $2,143 | $233,999 | $72,627 | $161,372 |
| 2016 | $1,920 | $112,344 | $34,140 | $78,204 |
| 2015 | $1,858 | $112,035 | $34,140 | $77,895 |
| 2014 | $1,870 | $112,013 | $34,140 | $77,873 |
Source: Public Records
Map
Nearby Homes
- 3832 W 5625 S
- 5412 S 3925 W
- 3826 W 5750 S
- 5444 S 4050 W
- 5773 S 3850 W
- 5856 S 3950 W
- 4239 W 5325 S
- 4309 W 5430 St #B S
- 5854 S 3500 W
- 4216 W 5250 S
- 4277 W 5250 S
- 3443 W 5200 S Unit 2&3
- 4403 W 5700 S
- 4088 W 5050 S
- 4218 W 5050 S
- 4264 W 6025 S
- 2216 W 2615 N Unit 142
- 4450 W 5775 S
- 2208 W 2615 N
- 2208 W 2615 N Unit 141
Your Personal Tour Guide
Ask me questions while you tour the home.