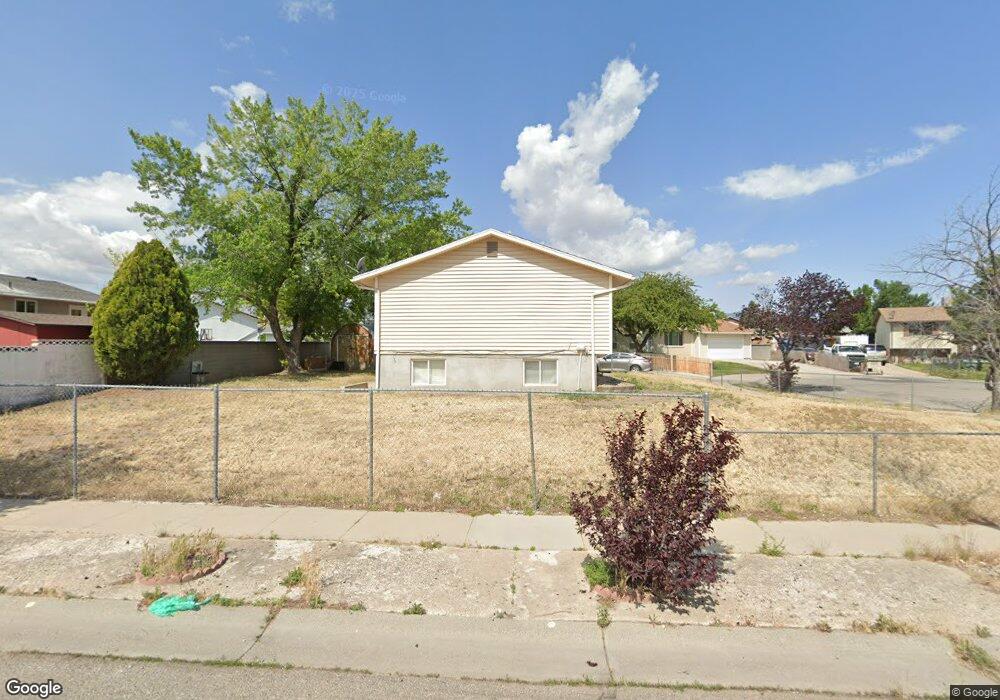
3849 W Farthington Cir West Jordan, UT 84088
Jordan Oaks NeighborhoodEstimated Value: $497,000 - $538,000
6
Beds
2
Baths
2,246
Sq Ft
$233/Sq Ft
Est. Value
About This Home
This home is located at 3849 W Farthington Cir, West Jordan, UT 84088 and is currently estimated at $524,119, approximately $233 per square foot. 3849 W Farthington Cir is a home located in Salt Lake County with nearby schools including Columbia Elementary School, Joel P. Jensen Middle School, and West Jordan High School.
Ownership History
Date
Name
Owned For
Owner Type
Purchase Details
Closed on
May 31, 2022
Sold by
Jasvinder Singh
Bought by
Rugingima Serubumbiro and Nyirabatware Liberata
Current Estimated Value
Home Financials for this Owner
Home Financials are based on the most recent Mortgage that was taken out on this home.
Original Mortgage
$510,581
Outstanding Balance
$485,094
Interest Rate
5.1%
Mortgage Type
FHA
Estimated Equity
$39,025
Purchase Details
Closed on
Feb 9, 1999
Sold by
Griego Kimberly Ann
Bought by
Westenskow Scott R and Westenskow Kim A
Home Financials for this Owner
Home Financials are based on the most recent Mortgage that was taken out on this home.
Original Mortgage
$138,000
Interest Rate
6.79%
Purchase Details
Closed on
Oct 16, 1997
Sold by
Carroll Alan D and Carroll Toni Rae
Bought by
Griego Kimberly Ann
Home Financials for this Owner
Home Financials are based on the most recent Mortgage that was taken out on this home.
Original Mortgage
$127,500
Interest Rate
7.49%
Create a Home Valuation Report for This Property
The Home Valuation Report is an in-depth analysis detailing your home's value as well as a comparison with similar homes in the area
Home Values in the Area
Average Home Value in this Area
Purchase History
| Date | Buyer | Sale Price | Title Company |
|---|---|---|---|
| Rugingima Serubumbiro | -- | Title Guarantee | |
| Westenskow Scott R | -- | United Title Services | |
| Griego Kimberly Ann | -- | -- |
Source: Public Records
Mortgage History
| Date | Status | Borrower | Loan Amount |
|---|---|---|---|
| Open | Rugingima Serubumbiro | $510,581 | |
| Previous Owner | Westenskow Scott R | $138,000 | |
| Previous Owner | Griego Kimberly Ann | $127,500 |
Source: Public Records
Tax History Compared to Growth
Tax History
| Year | Tax Paid | Tax Assessment Tax Assessment Total Assessment is a certain percentage of the fair market value that is determined by local assessors to be the total taxable value of land and additions on the property. | Land | Improvement |
|---|---|---|---|---|
| 2025 | $2,557 | $495,200 | $114,000 | $381,200 |
| 2024 | $2,557 | $492,000 | $110,600 | $381,400 |
| 2023 | $2,427 | $440,000 | $103,400 | $336,600 |
| 2022 | $2,509 | $447,500 | $101,400 | $346,100 |
| 2021 | $770 | $324,000 | $75,000 | $249,000 |
| 2020 | $916 | $311,100 | $75,000 | $236,100 |
| 2019 | $875 | $298,900 | $75,000 | $223,900 |
| 2018 | $473 | $236,900 | $70,800 | $166,100 |
| 2017 | $1,443 | $213,000 | $70,800 | $142,200 |
| 2016 | $1,344 | $186,300 | $70,800 | $115,500 |
| 2015 | $1,371 | $185,400 | $70,100 | $115,300 |
| 2014 | $1,311 | $174,500 | $66,800 | $107,700 |
Source: Public Records
Map
Nearby Homes
- 3888 W 8700 S
- 3931 W Dansere Cir
- 8400 S 4000 W Unit 134
- 8461 S Meadowlark Ln
- 8983 S 3860 W
- 3977 W Elwood Way
- 3750 W Bingham Creek Dr
- 8941 S Sun Leaf Dr
- 8180 S Old Bingham Hwy
- 3214 W Monterey Pine Ln
- 8493 S 3200 W
- 7991 S 3725 W
- 7989 S 3725 W
- 3546 W 7980 S
- 8058 S Lismore Ln Unit 304
- 9375 S Laurel Ridge Cir
- 3112 Green Acre Dr
- 3702 W Angus Dr
- 9029 S Ripple Dr
- 3332 Lower Newark Way
- 3849 Farthington Cir
- 3853 Farthington Cir
- 3846 Piccadilly Cir
- 3850 Piccadilly Cir
- 8681 Newcastle Rd
- 8693 Newcastle Rd
- 3850 Farthington Cir
- 3848 Farthington Cir
- 8689 Royal Crest Dr
- 8689 S Royal Crest Dr
- 8689 S Royal Crest Dr
- 8667 S Newcastle Rd
- 8667 Newcastle Rd
- 8701 Newcastle Rd
- 3852 Piccadilly Cir
- 8675 S Royal Crest Dr
- 8703 S Royal Crest Dr
- 8703 Royal Crest Dr
- 8675 Royal Crest Dr
- 3847 Piccadilly Cir