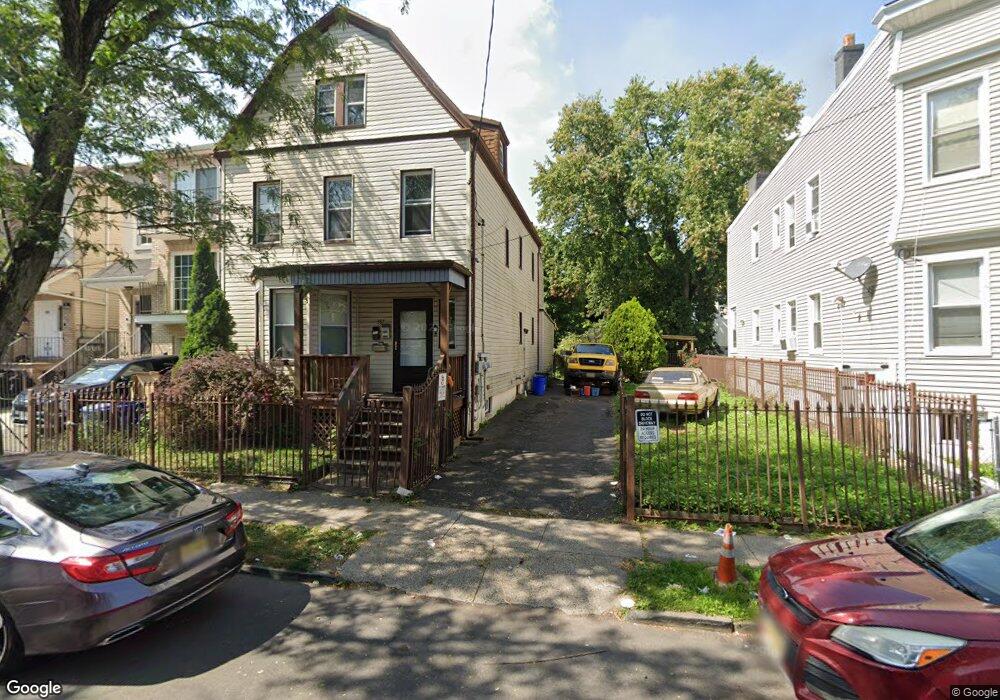
385 21st St Unit 3 Irvington, NJ 07111
Estimated Value: $570,000 - $670,539
--
Bed
1
Bath
2,334
Sq Ft
$259/Sq Ft
Est. Value
About This Home
This home is located at 385 21st St Unit 3, Irvington, NJ 07111 and is currently estimated at $604,635, approximately $259 per square foot. 385 21st St Unit 3 is a home located in Essex County with nearby schools including Irvington High School and Burch Charter School of Excellence.
Ownership History
Date
Name
Owned For
Owner Type
Purchase Details
Closed on
Aug 27, 2021
Sold by
490 21 Street Lot Llc
Bought by
White Delanno
Current Estimated Value
Home Financials for this Owner
Home Financials are based on the most recent Mortgage that was taken out on this home.
Original Mortgage
$323,000
Outstanding Balance
$292,817
Interest Rate
2.7%
Mortgage Type
New Conventional
Estimated Equity
$311,818
Purchase Details
Closed on
Mar 17, 2021
Sold by
Rice Eleanor L and Rice Eleanor L
Bought by
490 21 Street Lot Llc
Create a Home Valuation Report for This Property
The Home Valuation Report is an in-depth analysis detailing your home's value as well as a comparison with similar homes in the area
Home Values in the Area
Average Home Value in this Area
Purchase History
| Date | Buyer | Sale Price | Title Company |
|---|---|---|---|
| White Delanno | $380,000 | First American Title Ins Co | |
| 490 21 Street Lot Llc | $235,000 | Old Republic Natl Ttl Ins Co |
Source: Public Records
Mortgage History
| Date | Status | Borrower | Loan Amount |
|---|---|---|---|
| Open | White Delanno | $323,000 |
Source: Public Records
Tax History Compared to Growth
Tax History
| Year | Tax Paid | Tax Assessment Tax Assessment Total Assessment is a certain percentage of the fair market value that is determined by local assessors to be the total taxable value of land and additions on the property. | Land | Improvement |
|---|---|---|---|---|
| 2025 | $10,804 | $515,600 | $125,900 | $389,700 |
| 2024 | $10,804 | $177,900 | $21,400 | $156,500 |
| 2022 | $10,605 | $177,900 | $21,400 | $156,500 |
| 2021 | $6,332 | $105,900 | $21,400 | $84,500 |
| 2020 | $6,329 | $105,900 | $21,400 | $84,500 |
| 2019 | $5,907 | $105,900 | $21,400 | $84,500 |
| 2018 | $5,787 | $105,900 | $21,400 | $84,500 |
| 2017 | $5,760 | $105,900 | $21,400 | $84,500 |
| 2016 | $5,630 | $105,900 | $21,400 | $84,500 |
| 2015 | $5,493 | $105,900 | $21,400 | $84,500 |
| 2014 | $5,528 | $105,900 | $21,400 | $84,500 |
Source: Public Records
Map
Nearby Homes