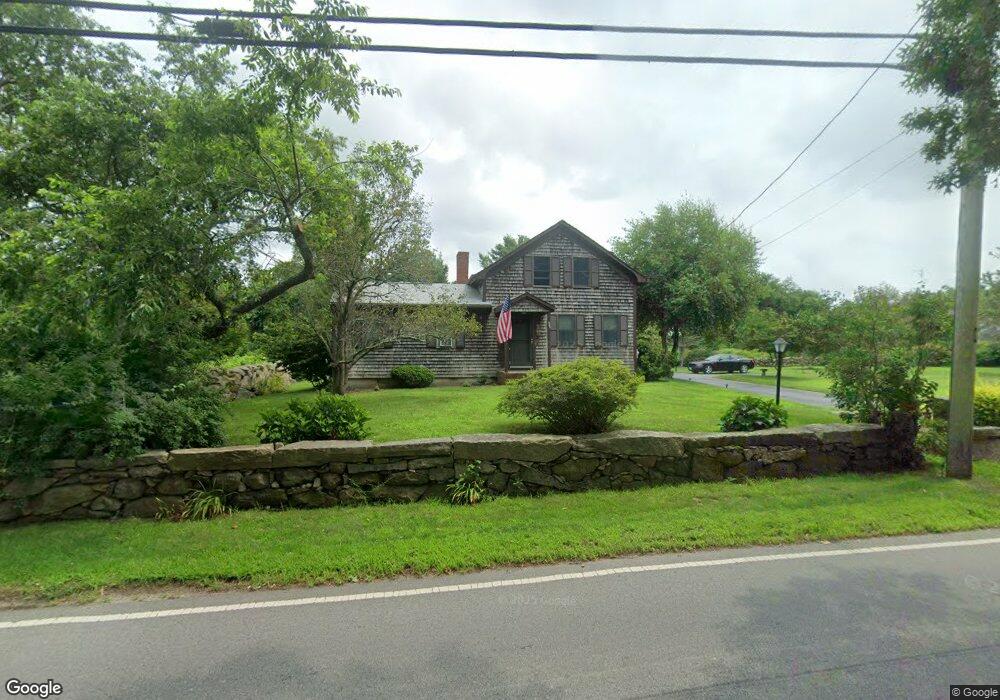
385 Bakerville Rd South Dartmouth, MA 02748
Wilburtie Corner NeighborhoodEstimated Value: $586,000 - $658,000
4
Beds
3
Baths
1,640
Sq Ft
$372/Sq Ft
Est. Value
About This Home
This home is located at 385 Bakerville Rd, South Dartmouth, MA 02748 and is currently estimated at $610,495, approximately $372 per square foot. 385 Bakerville Rd is a home located in Bristol County with nearby schools including Dartmouth High School, Friends Academy, and Bishop Stang High School.
Ownership History
Date
Name
Owned For
Owner Type
Purchase Details
Closed on
May 3, 2023
Sold by
Terpeny Mark J and Terpeny Jody L
Bought by
Terpeny Ft
Current Estimated Value
Purchase Details
Closed on
Feb 22, 1980
Bought by
Terpeny Mark J and Terpeny Jody L
Create a Home Valuation Report for This Property
The Home Valuation Report is an in-depth analysis detailing your home's value as well as a comparison with similar homes in the area
Home Values in the Area
Average Home Value in this Area
Purchase History
| Date | Buyer | Sale Price | Title Company |
|---|---|---|---|
| Terpeny Ft | -- | None Available | |
| Terpeny Mark J | -- | -- |
Source: Public Records
Mortgage History
| Date | Status | Borrower | Loan Amount |
|---|---|---|---|
| Previous Owner | Terpeny Mark J | $125,000 | |
| Previous Owner | Terpeny Mark J | $40,000 | |
| Previous Owner | Terpeny Mark J | $87,500 | |
| Previous Owner | Terpeny Mark J | $40,000 |
Source: Public Records
Tax History Compared to Growth
Tax History
| Year | Tax Paid | Tax Assessment Tax Assessment Total Assessment is a certain percentage of the fair market value that is determined by local assessors to be the total taxable value of land and additions on the property. | Land | Improvement |
|---|---|---|---|---|
| 2025 | $4,129 | $479,600 | $240,200 | $239,400 |
| 2024 | $3,897 | $448,500 | $229,100 | $219,400 |
| 2023 | $3,814 | $415,900 | $212,500 | $203,400 |
| 2022 | $3,696 | $373,300 | $203,300 | $170,000 |
| 2021 | $0 | $331,300 | $179,600 | $151,700 |
| 2020 | $3,378 | $325,400 | $179,600 | $145,800 |
| 2019 | $3,307 | $318,000 | $179,600 | $138,400 |
| 2018 | $3,138 | $311,500 | $179,600 | $131,900 |
| 2017 | $3,037 | $303,100 | $169,300 | $133,800 |
| 2016 | $2,871 | $282,600 | $162,000 | $120,600 |
| 2015 | $2,773 | $273,500 | $151,200 | $122,300 |
| 2014 | $2,628 | $257,400 | $137,300 | $120,100 |
Source: Public Records
Map
Nearby Homes
- 248 Bakerville Rd
- 34 Country Way
- 75 Country Way Unit 75
- 360 Russells Mills Rd
- 3 Mishawum Dr
- 5 Samosett Dr
- 76 Shipyard Ln
- 48 Wilson St
- 1150 Russells Mills Rd
- 14 Westview Dr
- 10 Westview Dr
- 21 Avis St
- 6 Jacob Dr
- 212 Rockland St
- 105 Rock Odundee Rd
- 738 Smith Neck Rd
- 61 Pardon Hill Rd
- 24 White Alder Way
- 40 School St
- 00 Prospect St
- 386 Bakerville Rd
- 1 Simmons Way
- 39 Beechwood Dr
- 389 Bakerville Rd
- 394 Bakerville Rd
- 37 Beechwood Dr
- 6 Twin Ponds Dr
- 370 Bakerville Rd
- 35 Beechwood Dr
- 7 Twin Ponds Dr
- 40 Beechwood Dr
- 366 Bakerville Rd
- 38 Beechwood Dr
- 10 Twin Ponds Dr
- 407 Bakerville Rd
- 395 Gulf Rd W
- 387 Gulf Rd W
- 36 Beechwood Dr
- 00 Bakerville Rd
- 0 Bakerville Rd