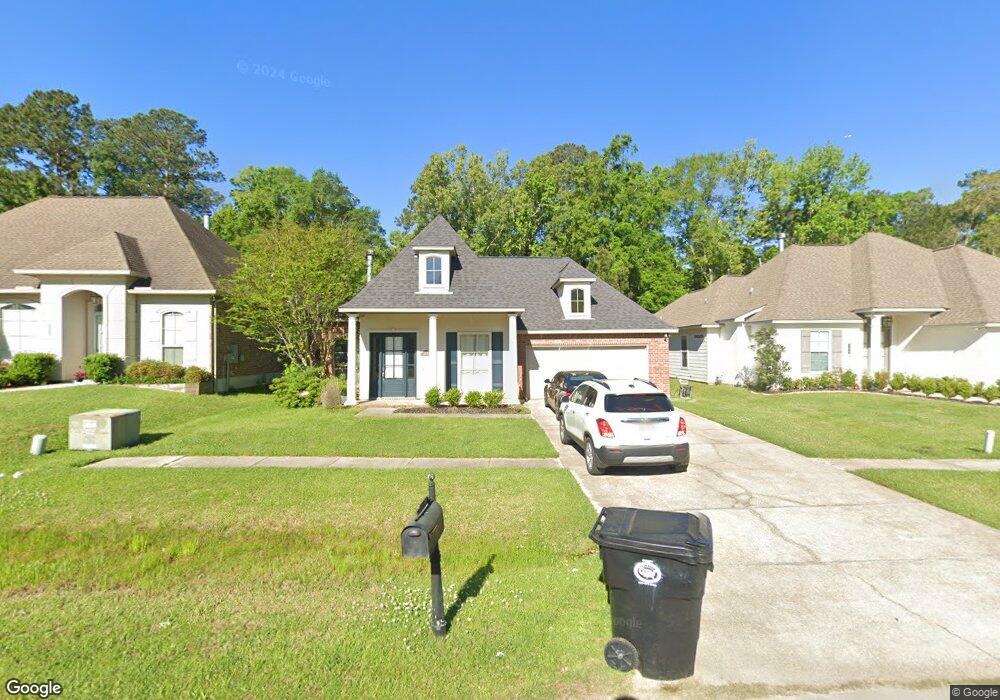
385 Brown Thrasher Loop N Madisonville, LA 70447
Estimated Value: $297,000 - $347,000
3
Beds
2
Baths
1,882
Sq Ft
$173/Sq Ft
Est. Value
About This Home
This home is located at 385 Brown Thrasher Loop N, Madisonville, LA 70447 and is currently estimated at $325,588, approximately $173 per square foot. 385 Brown Thrasher Loop N is a home located in St. Tammany Parish with nearby schools including Madisonville Elementary School, Joseph B. Lancaster Elementary School, and Madisonville Junior High School.
Ownership History
Date
Name
Owned For
Owner Type
Purchase Details
Closed on
Mar 25, 2021
Sold by
Warshauer Ryan William and Warshauer Desiree Morsch
Bought by
Aizen Brady Jacob
Current Estimated Value
Home Financials for this Owner
Home Financials are based on the most recent Mortgage that was taken out on this home.
Original Mortgage
$260,200
Outstanding Balance
$231,956
Interest Rate
2.9%
Mortgage Type
FHA
Estimated Equity
$93,632
Purchase Details
Closed on
Jul 30, 2019
Sold by
English David E and English Jessica D
Bought by
Morsch Warshauer Ryan William and Morsch Warshauver Desiree
Purchase Details
Closed on
Feb 17, 2014
Sold by
Kessler David M and Kessler Amand S
Bought by
English David E and English Jessica D
Home Financials for this Owner
Home Financials are based on the most recent Mortgage that was taken out on this home.
Original Mortgage
$199,405
Interest Rate
4.47%
Mortgage Type
New Conventional
Create a Home Valuation Report for This Property
The Home Valuation Report is an in-depth analysis detailing your home's value as well as a comparison with similar homes in the area
Home Values in the Area
Average Home Value in this Area
Purchase History
| Date | Buyer | Sale Price | Title Company |
|---|---|---|---|
| Aizen Brady Jacob | $265,000 | Crescent Title Llc | |
| Morsch Warshauer Ryan William | $195,450 | Crescent Title | |
| English David E | $209,900 | Allegiance Title |
Source: Public Records
Mortgage History
| Date | Status | Borrower | Loan Amount |
|---|---|---|---|
| Open | Aizen Brady Jacob | $260,200 | |
| Previous Owner | English David E | $199,405 |
Source: Public Records
Tax History
| Year | Tax Paid | Tax Assessment Tax Assessment Total Assessment is a certain percentage of the fair market value that is determined by local assessors to be the total taxable value of land and additions on the property. | Land | Improvement |
|---|---|---|---|---|
| 2025 | $3,061 | $26,233 | $4,000 | $22,233 |
| 2024 | $3,061 | $26,233 | $4,000 | $22,233 |
| 2023 | $3,137 | $23,285 | $4,000 | $19,285 |
| 2022 | $301,843 | $23,285 | $4,000 | $19,285 |
| 2021 | $2,790 | $21,567 | $4,000 | $17,567 |
| 2020 | $2,797 | $21,567 | $4,000 | $17,567 |
| 2019 | $2,634 | $19,691 | $4,000 | $15,691 |
| 2018 | $2,637 | $19,691 | $4,000 | $15,691 |
| 2017 | $2,656 | $19,691 | $4,000 | $15,691 |
| 2016 | $2,668 | $19,691 | $4,000 | $15,691 |
| 2015 | $1,741 | $20,063 | $4,000 | $16,063 |
| 2014 | $1,751 | $20,274 | $4,000 | $16,274 |
| 2013 | -- | $20,274 | $4,000 | $16,274 |
Source: Public Records
Map
Nearby Homes
- 400 Brown Thrasher Loop S
- 320 Brown Thrasher Loop S
- 305 Brown Thrasher Loop S
- 632 Brown Thrasher Loop N
- 7020 Ring Neck Dr
- 1017 Fox Sparrow Loop
- 1205 Fox Sparrow Loop
- 2024 White Dove Dr
- 2008 White Dove Dr
- 228 Snowy Egret Ct
- 2049 White Dove Dr
- 467 Bedico Pkwy
- 155 White Heron Dr
- 161 Woodthrush Dr
- 165 Wood Thrush Dr
- 145 White Heron Dr
- 385 Brown Thrasher Loop S
- 389 Brown Thrasher Loop S
- 381 Brown Thrasher Loop S
- 393 Brown Thrasher Loop S
- 0 Brown Trasher Loop S
- 393 Brown Thrasher Loop S
- 377 Brown Thrasher Loop S
- Lot 168 Brown Thrasher Loop S
- 0 Brown Thrasher Loop S
- 380 Brown Thrasher Loop S
- 384 Brown Thrasher Loop S
- 384 Brown Thrasher Loop S
- 384 Brown Thrasher Other
- 397 Brown Thrasher Loop S
- 380 Brown Thrasher Loop S
- 380 Brown Thrasher Loop S
- 388 Brown Thrasher Loop S
- 388 Brown Thrasher Loop S
- 388 Brown Thrasher Loop S
- 373 Brown Thrasher Loop S
Your Personal Tour Guide
Ask me questions while you tour the home.