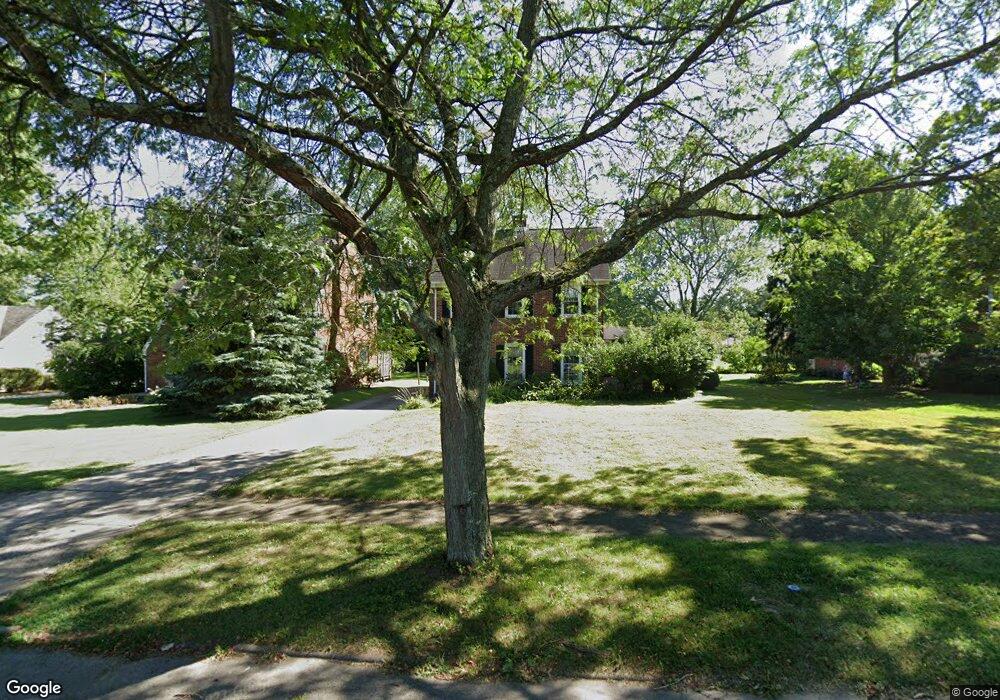
385 Davis Rd Mansfield, OH 44907
Estimated Value: $173,000 - $190,000
4
Beds
2
Baths
1,668
Sq Ft
$107/Sq Ft
Est. Value
About This Home
This home is located at 385 Davis Rd, Mansfield, OH 44907 and is currently estimated at $178,709, approximately $107 per square foot. 385 Davis Rd is a home located in Richland County with nearby schools including Discovery School, St. Peter's Elementary/Montessori School, and St. Peter's Junior High / High School.
Ownership History
Date
Name
Owned For
Owner Type
Purchase Details
Closed on
Jun 25, 2020
Sold by
Hockman Jennifer Lynn and Hockman Joshua L
Bought by
Hockman Josha L and Hockman Jennifer Lynn
Current Estimated Value
Purchase Details
Closed on
May 14, 2014
Sold by
Prout Willis and Prout Sherri
Bought by
Prout Willis and Prout Sherri
Purchase Details
Closed on
May 28, 2010
Sold by
Fannie Mae
Bought by
Prout Willis
Purchase Details
Closed on
Dec 21, 2009
Sold by
Smith Brian D
Bought by
Federal National Mortgage Association
Purchase Details
Closed on
Oct 30, 1996
Sold by
Fleischauer John Eric
Bought by
Smith Brian D and Smith Leesa R
Home Financials for this Owner
Home Financials are based on the most recent Mortgage that was taken out on this home.
Original Mortgage
$60,000
Interest Rate
8.23%
Mortgage Type
New Conventional
Purchase Details
Closed on
Jul 1, 1986
Create a Home Valuation Report for This Property
The Home Valuation Report is an in-depth analysis detailing your home's value as well as a comparison with similar homes in the area
Home Values in the Area
Average Home Value in this Area
Purchase History
| Date | Buyer | Sale Price | Title Company |
|---|---|---|---|
| Hockman Josha L | -- | None Available | |
| Prout Willis | -- | Southern Title | |
| Prout Willis | $55,600 | Southern Title | |
| Federal National Mortgage Association | $114,595 | None Available | |
| Smith Brian D | $85,000 | -- | |
| -- | $58,000 | -- |
Source: Public Records
Mortgage History
| Date | Status | Borrower | Loan Amount |
|---|---|---|---|
| Previous Owner | Smith Brian D | $60,000 |
Source: Public Records
Tax History
| Year | Tax Paid | Tax Assessment Tax Assessment Total Assessment is a certain percentage of the fair market value that is determined by local assessors to be the total taxable value of land and additions on the property. | Land | Improvement |
|---|---|---|---|---|
| 2024 | $2,100 | $43,860 | $6,150 | $37,710 |
| 2023 | $2,100 | $43,860 | $6,150 | $37,710 |
| 2022 | $1,887 | $33,040 | $5,500 | $27,540 |
| 2021 | $1,901 | $33,040 | $5,500 | $27,540 |
| 2020 | $1,944 | $33,040 | $5,500 | $27,540 |
| 2019 | $1,829 | $28,040 | $4,660 | $23,380 |
| 2018 | $1,804 | $28,040 | $4,660 | $23,380 |
| 2017 | $1,600 | $32,950 | $4,660 | $28,290 |
| 2016 | $1,137 | $17,600 | $4,660 | $12,940 |
| 2015 | $1,085 | $17,600 | $4,660 | $12,940 |
| 2014 | $1,071 | $17,600 | $4,660 | $12,940 |
| 2012 | $410 | $17,600 | $4,660 | $12,940 |
Source: Public Records
Map
Nearby Homes
- 341 Townview Cir N
- 471 Midland Dr
- 310 Townview Cir N
- 575 Crescent Rd
- 695 S Andover Rd
- 470 Lexington Ave
- 466 Lexington Ave
- 456 Lexington Ave
- 616 Cline Ave
- 655 Woodhill Rd
- 0 Cline Ave Hedeen Abbeyfeale Unit 9066362
- 282 Vennum Ave
- 512 Woodward Ave
- 0 George Ave
- 151 Grover St
- 487 Davey Ave
- 810 Lexington Ave
- 27 Dunbilt Ct
- 219 Lexington Ave
- 101 Chilton Ave
Your Personal Tour Guide
Ask me questions while you tour the home.