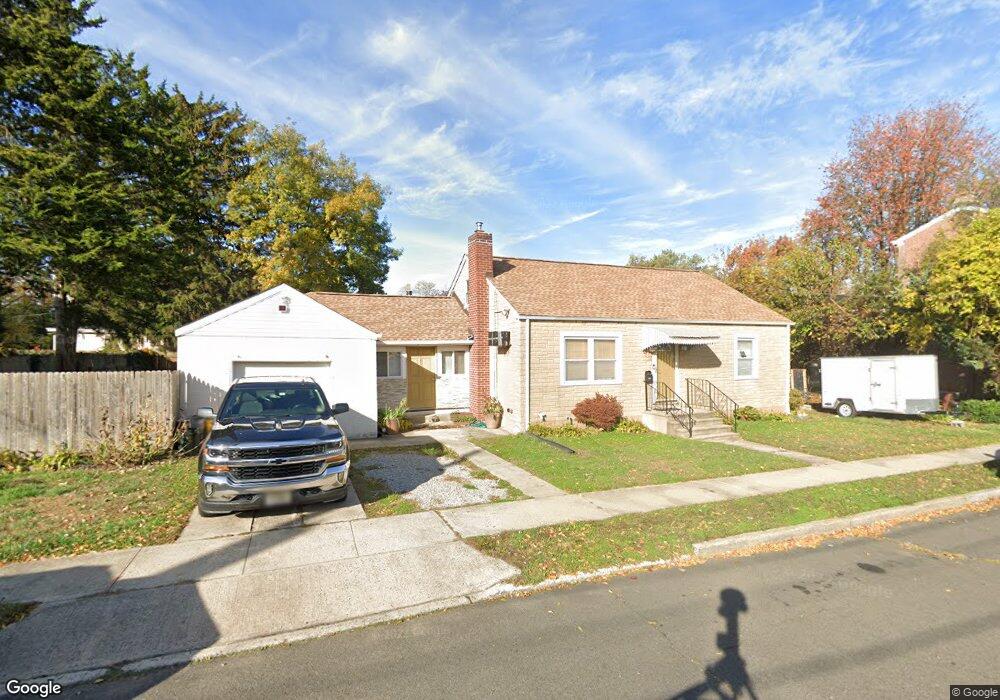
385 Durand Ave Trenton, NJ 08611
Franklin Park NeighborhoodEstimated Value: $228,000 - $260,277
2
Beds
1
Bath
980
Sq Ft
$250/Sq Ft
Est. Value
About This Home
This home is located at 385 Durand Ave, Trenton, NJ 08611 and is currently estimated at $245,319, approximately $250 per square foot. 385 Durand Ave is a home located in Mercer County with nearby schools including Lalor Elementary School, Richard C. Crockett Middle School, and Hamilton West-Watson High School.
Ownership History
Date
Name
Owned For
Owner Type
Purchase Details
Closed on
Jul 29, 2010
Sold by
Bayous Margaret
Bought by
Thompson Curtis L
Current Estimated Value
Home Financials for this Owner
Home Financials are based on the most recent Mortgage that was taken out on this home.
Original Mortgage
$113,471
Outstanding Balance
$75,920
Interest Rate
4.78%
Mortgage Type
FHA
Estimated Equity
$169,399
Create a Home Valuation Report for This Property
The Home Valuation Report is an in-depth analysis detailing your home's value as well as a comparison with similar homes in the area
Home Values in the Area
Average Home Value in this Area
Purchase History
| Date | Buyer | Sale Price | Title Company |
|---|---|---|---|
| Thompson Curtis L | $115,000 | Sterling Title Agency |
Source: Public Records
Mortgage History
| Date | Status | Borrower | Loan Amount |
|---|---|---|---|
| Open | Thompson Curtis L | $113,471 |
Source: Public Records
Tax History Compared to Growth
Tax History
| Year | Tax Paid | Tax Assessment Tax Assessment Total Assessment is a certain percentage of the fair market value that is determined by local assessors to be the total taxable value of land and additions on the property. | Land | Improvement |
|---|---|---|---|---|
| 2025 | $5,071 | $143,900 | $32,500 | $111,400 |
| 2024 | $4,753 | $143,900 | $32,500 | $111,400 |
| 2023 | $4,753 | $143,900 | $32,500 | $111,400 |
| 2022 | $4,678 | $143,900 | $32,500 | $111,400 |
| 2021 | $5,789 | $143,900 | $32,500 | $111,400 |
| 2020 | $5,271 | $143,900 | $32,500 | $111,400 |
| 2019 | $5,116 | $143,900 | $32,500 | $111,400 |
| 2018 | $5,136 | $146,400 | $35,000 | $111,400 |
| 2017 | $4,907 | $146,400 | $35,000 | $111,400 |
| 2016 | $3,959 | $146,400 | $35,000 | $111,400 |
| 2015 | $5,574 | $107,000 | $27,000 | $80,000 |
| 2014 | $5,501 | $107,000 | $27,000 | $80,000 |
Source: Public Records
Map
Nearby Homes