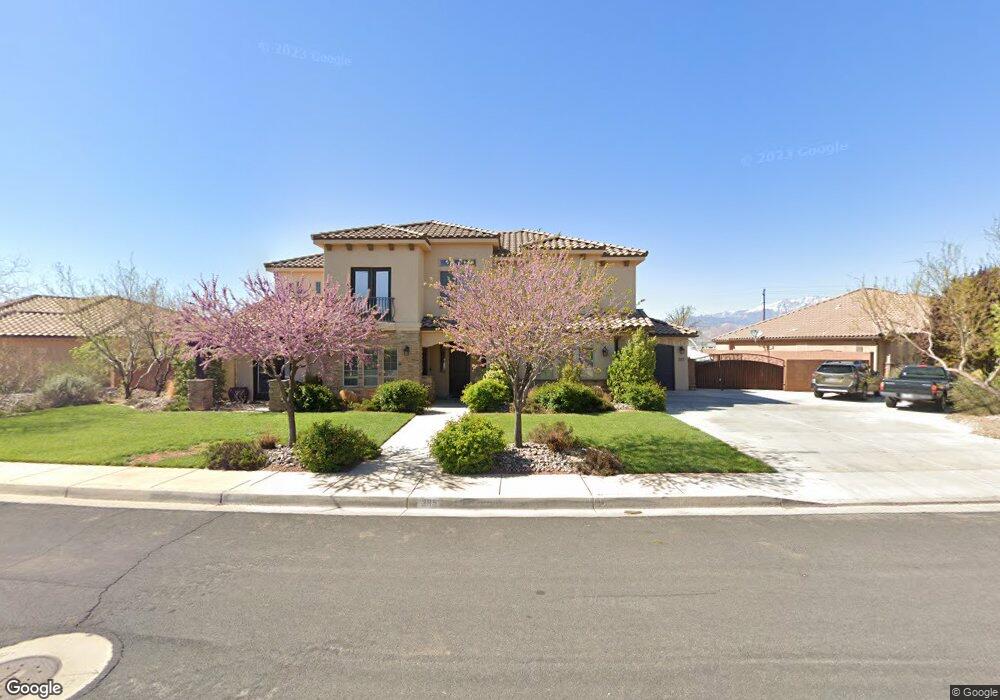
385 E Stonehedge Cir Washington, UT 84780
Estimated Value: $797,203 - $1,017,000
6
Beds
5
Baths
4,124
Sq Ft
$211/Sq Ft
Est. Value
About This Home
This home is located at 385 E Stonehedge Cir, Washington, UT 84780 and is currently estimated at $871,051, approximately $211 per square foot. 385 E Stonehedge Cir is a home with nearby schools including Majestic Fields School, Crimson Cliffs Middle School, and Washington Fields Intermediate School.
Ownership History
Date
Name
Owned For
Owner Type
Purchase Details
Closed on
Oct 7, 2020
Sold by
Carling Jarel B
Bought by
Carling Jarel B and Carling Rachel W
Current Estimated Value
Home Financials for this Owner
Home Financials are based on the most recent Mortgage that was taken out on this home.
Original Mortgage
$356,000
Outstanding Balance
$255,870
Interest Rate
2.9%
Mortgage Type
New Conventional
Estimated Equity
$615,181
Purchase Details
Closed on
Aug 27, 2012
Sold by
Carling Jarel B
Bought by
Carling Jarel B and Carling Rachel W
Home Financials for this Owner
Home Financials are based on the most recent Mortgage that was taken out on this home.
Original Mortgage
$290,700
Interest Rate
3.49%
Mortgage Type
New Conventional
Purchase Details
Closed on
Jan 13, 2011
Sold by
Carling Jarel B
Bought by
Carling Jarel B and Carling Rachel W
Home Financials for this Owner
Home Financials are based on the most recent Mortgage that was taken out on this home.
Original Mortgage
$287,853
Interest Rate
4.43%
Mortgage Type
New Conventional
Create a Home Valuation Report for This Property
The Home Valuation Report is an in-depth analysis detailing your home's value as well as a comparison with similar homes in the area
Purchase History
| Date | Buyer | Sale Price | Title Company |
|---|---|---|---|
| Carling Jarel B | -- | Gt Title Services | |
| Carling Jarel B | -- | Gt Title | |
| Carling Jarel B | -- | Provo Land Title Company | |
| Carling Jarel B | -- | Provo Land Title Company | |
| Carling Jarel B | -- | Provo Land Title Co | |
| Carling Jarel B | -- | Provo Land Title Co |
Source: Public Records
Mortgage History
| Date | Status | Borrower | Loan Amount |
|---|---|---|---|
| Open | Carling Jarel B | $356,000 | |
| Closed | Carling Jarel B | $290,700 | |
| Closed | Carling Jarel B | $287,853 |
Source: Public Records
Tax History
| Year | Tax Paid | Tax Assessment Tax Assessment Total Assessment is a certain percentage of the fair market value that is determined by local assessors to be the total taxable value of land and additions on the property. | Land | Improvement |
|---|---|---|---|---|
| 2025 | $2,466 | $384,395 | $101,750 | $282,645 |
| 2023 | $2,597 | $389,730 | $93,500 | $296,230 |
| 2022 | $2,911 | $411,125 | $79,750 | $331,375 |
| 2021 | $2,331 | $489,500 | $100,000 | $389,500 |
| 2020 | $2,352 | $467,100 | $95,000 | $372,100 |
| 2019 | $2,364 | $458,600 | $95,000 | $363,600 |
| 2018 | $2,303 | $230,890 | $0 | $0 |
| 2017 | $2,109 | $205,755 | $0 | $0 |
| 2016 | $2,108 | $190,410 | $0 | $0 |
| 2015 | $2,099 | $182,435 | $0 | $0 |
| 2014 | $2,004 | $175,285 | $0 | $0 |
Source: Public Records
Map
Nearby Homes
- 3673 S Cannon Way
- 0 Reserve at Old Farm
- Lot 32 the Reserve at Old Farm
- 519 E Steeplechase Rd
- 353 E 3500 S
- 3920 S Steeplechase Rd
- 439 E 3500 S
- Lot 26 the Reserve at Old Farm
- 501 E Tincup Ln Unit 31
- 501 E Tincup Ln
- 980 E 3650 S
- 429 E Treasure Valley Rd
- 429 Treasure Valley Rd
- 524 Bailey Ln
- 536 Bailey Ln
- 3701 S Mckenzie Ln
- 3736 S Mckenzie Ln Unit 140
- 4087 S Signature Way
- 3761 S Kennedy Ln Unit 134
- 4145 S 435 E
- 403 E Stonehedge Cir
- 359 E Stonehedge Cir
- 388 E Stonehedge Cir
- 360 E 3650 S
- 408 E Stonehedge Cir
- 408 Stonehedge Dr
- 335 E Stonehedge Dr
- 417 Stonehedge Dr
- 368 E Stonehedge Cir
- 422 E Stonehedge Cir
- 334 E Stonehedge Dr
- 3691 S Cannon Way
- 3763 S Cannon Way
- 3755 S Stoney Hill Rd
- 3760 S Stoney Hill Rd
- 314 E Stonehedge Dr
- 294 E Stonehedge Dr
- 3767 S Stoney Hill Rd
- 275 E Stonehedge Dr
- 3780 S Stoney Hill Rd
Your Personal Tour Guide
Ask me questions while you tour the home.