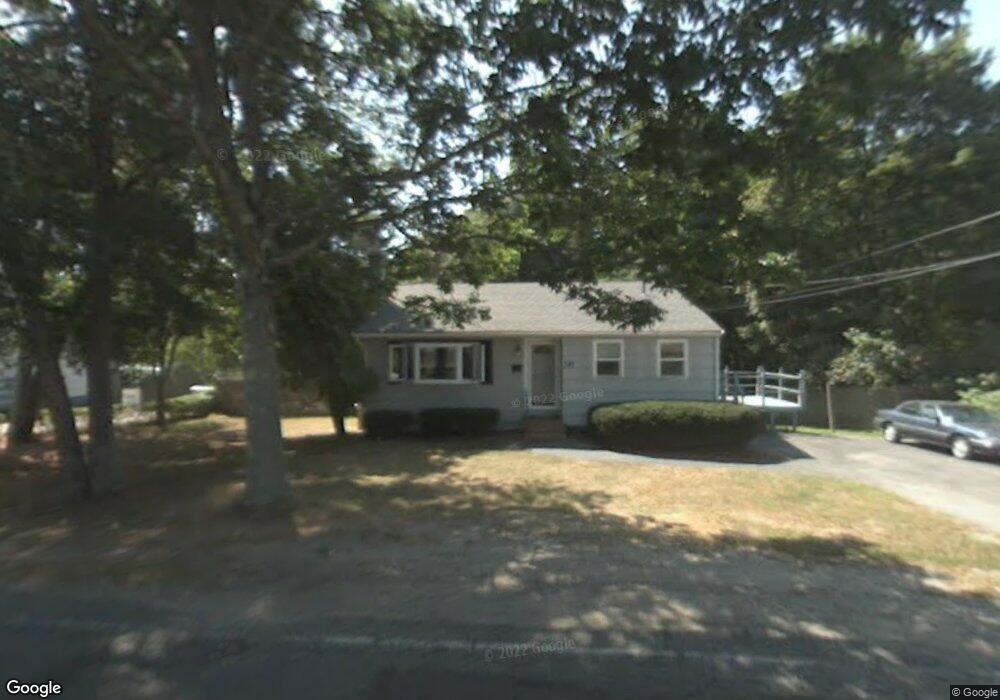
385 East St Brockton, MA 02302
Estimated Value: $462,900 - $502,000
3
Beds
1
Bath
1,312
Sq Ft
$362/Sq Ft
Est. Value
About This Home
This home is located at 385 East St, Brockton, MA 02302 and is currently estimated at $474,475, approximately $361 per square foot. 385 East St is a home located in Plymouth County with nearby schools including Davis K-8 School, John F. Kennedy Elementary School, and South Middle School.
Ownership History
Date
Name
Owned For
Owner Type
Purchase Details
Closed on
Jan 24, 1992
Sold by
Ostrom Alexander B and Ostrum Annette
Bought by
Trochez Jose A and Trochez Lisa M
Current Estimated Value
Home Financials for this Owner
Home Financials are based on the most recent Mortgage that was taken out on this home.
Original Mortgage
$91,800
Interest Rate
8.45%
Mortgage Type
Purchase Money Mortgage
Create a Home Valuation Report for This Property
The Home Valuation Report is an in-depth analysis detailing your home's value as well as a comparison with similar homes in the area
Home Values in the Area
Average Home Value in this Area
Purchase History
| Date | Buyer | Sale Price | Title Company |
|---|---|---|---|
| Trochez Jose A | $102,000 | -- |
Source: Public Records
Mortgage History
| Date | Status | Borrower | Loan Amount |
|---|---|---|---|
| Closed | Trochez Jose A | $91,800 | |
| Previous Owner | Trochez Jose A | $42,930 | |
| Previous Owner | Trochez Jose A | $12,600 |
Source: Public Records
Tax History Compared to Growth
Tax History
| Year | Tax Paid | Tax Assessment Tax Assessment Total Assessment is a certain percentage of the fair market value that is determined by local assessors to be the total taxable value of land and additions on the property. | Land | Improvement |
|---|---|---|---|---|
| 2025 | $4,804 | $396,700 | $157,500 | $239,200 |
| 2024 | $4,739 | $394,300 | $157,500 | $236,800 |
| 2023 | $4,463 | $343,800 | $107,700 | $236,100 |
| 2022 | $4,525 | $323,900 | $97,900 | $226,000 |
| 2021 | $4,053 | $279,500 | $90,000 | $189,500 |
| 2020 | $3,881 | $256,200 | $79,300 | $176,900 |
| 2019 | $3,888 | $250,200 | $75,400 | $174,800 |
| 2018 | $3,472 | $216,200 | $75,400 | $140,800 |
| 2017 | $3,310 | $205,600 | $75,400 | $130,200 |
| 2016 | $2,991 | $172,300 | $71,900 | $100,400 |
| 2015 | $2,855 | $157,300 | $71,900 | $85,400 |
| 2014 | $2,761 | $152,300 | $71,900 | $80,400 |
Source: Public Records
Map
Nearby Homes