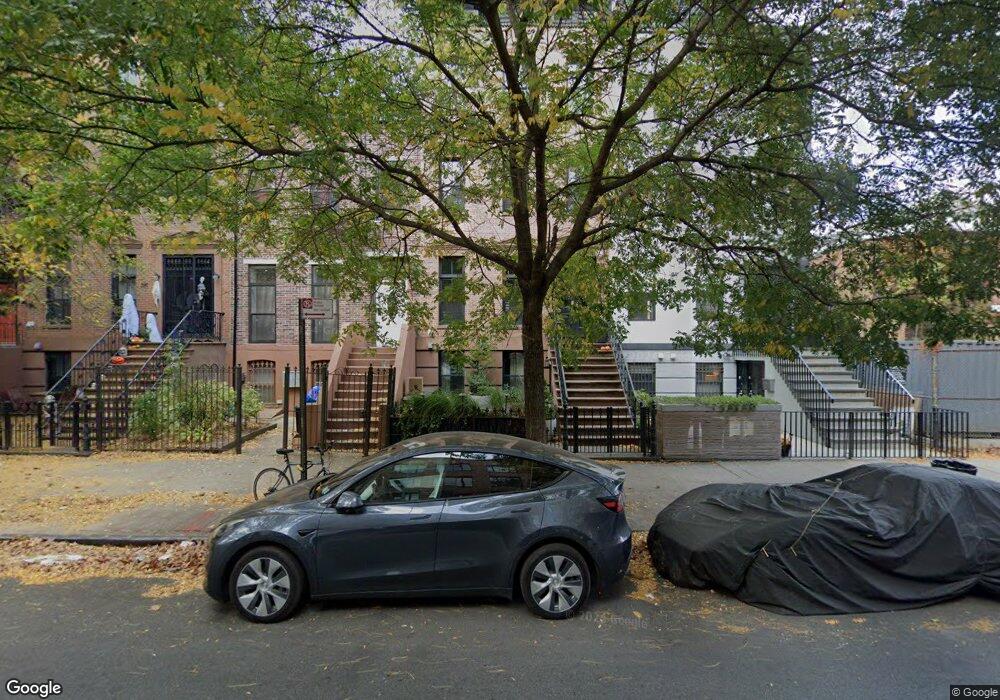
385 Gates Ave Unit Building Brooklyn, NY 11216
Bed-Stuy NeighborhoodEstimated Value: $3,091,859 - $4,892,000
--
Bed
--
Bath
3,925
Sq Ft
$946/Sq Ft
Est. Value
About This Home
This home is located at 385 Gates Ave Unit Building, Brooklyn, NY 11216 and is currently estimated at $3,713,465, approximately $946 per square foot. 385 Gates Ave Unit Building is a home located in Kings County with nearby schools including P.S. 305 Dr. Peter Ray, Brooklyn East Collegiate Charter School, and Brooklyn Academy High School.
Ownership History
Date
Name
Owned For
Owner Type
Purchase Details
Closed on
Feb 10, 2020
Sold by
Gates Group Llc
Bought by
Bernard Browne Russell and Browne Maria
Current Estimated Value
Home Financials for this Owner
Home Financials are based on the most recent Mortgage that was taken out on this home.
Original Mortgage
$2,480,000
Outstanding Balance
$2,200,853
Interest Rate
3.72%
Mortgage Type
Unknown
Estimated Equity
$1,512,612
Purchase Details
Closed on
Oct 21, 2015
Sold by
Onuoha Anagha
Bought by
Gates Group Llc
Purchase Details
Closed on
Apr 15, 2002
Sold by
Emeka Joe and Gunn Nelson
Bought by
Onuoha Anagha
Home Financials for this Owner
Home Financials are based on the most recent Mortgage that was taken out on this home.
Original Mortgage
$247,200
Interest Rate
6.2%
Create a Home Valuation Report for This Property
The Home Valuation Report is an in-depth analysis detailing your home's value as well as a comparison with similar homes in the area
Home Values in the Area
Average Home Value in this Area
Purchase History
| Date | Buyer | Sale Price | Title Company |
|---|---|---|---|
| Bernard Browne Russell | $3,100,000 | -- | |
| Gates Group Llc | $575,000 | -- | |
| Onuoha Anagha | -- | -- |
Source: Public Records
Mortgage History
| Date | Status | Borrower | Loan Amount |
|---|---|---|---|
| Open | Bernard Browne Russell | $2,480,000 | |
| Previous Owner | Onuoha Anagha | $247,200 |
Source: Public Records
Tax History Compared to Growth
Tax History
| Year | Tax Paid | Tax Assessment Tax Assessment Total Assessment is a certain percentage of the fair market value that is determined by local assessors to be the total taxable value of land and additions on the property. | Land | Improvement |
|---|---|---|---|---|
| 2025 | $11,743 | $210,720 | $14,160 | $196,560 |
| 2024 | $11,743 | $176,640 | $14,160 | $162,480 |
| 2023 | $11,202 | $156,120 | $14,160 | $141,960 |
| 2022 | $10,897 | $147,900 | $14,160 | $133,740 |
| 2021 | $11,374 | $114,180 | $14,160 | $100,020 |
| 2020 | $8,531 | $115,500 | $14,160 | $101,340 |
| 2019 | $9,284 | $105,960 | $14,160 | $91,800 |
| 2018 | $1,771 | $8,686 | $1,712 | $6,974 |
| 2017 | $1,674 | $8,210 | $2,553 | $5,657 |
| 2016 | $1,551 | $7,761 | $3,259 | $4,502 |
| 2015 | $934 | $7,761 | $2,313 | $5,448 |
| 2014 | $934 | $7,663 | $2,740 | $4,923 |
Source: Public Records
Map
Nearby Homes
- 358 Gates Ave
- 337 Nostrand Ave Unit 301B
- 235 Lexington Ave
- 197 Madison St
- 173 Quincy St
- 190 Lexington Ave
- 276A Quincy St Unit A
- 1142 Bedford Ave Unit 4F
- 406 Greene Ave Unit 3
- 237 Madison St
- 293 Putnam Ave
- 292 Gates Ave
- 241A Madison St
- 95 Monroe St
- 232A Putnam Ave
- 256 Putnam Ave Unit 1
- 256 Putnam Ave Unit 4PH
- 198 Putnam Ave
- 376 Greene Ave
- 90 Monroe St
- 385 Gates Ave
- 383 Gates Ave
- 387 Gates Ave
- 381 Gates Ave
- 379 Gates Ave
- 377A Gates Ave
- 393 Gates Ave
- 377 Gates Ave
- 238 Quincy St
- 236 Quincy St
- 240 Quincy St
- 234 Quincy St
- 242 Quincy St
- 375 Gates Ave
- 244 Quincy St
- 232 Quincy St Unit 4
- 232 Quincy St
- 230 Quincy St
- 230 Quincy St Unit Building
- 373 Gates Ave Unit 4