Estimated Value: $268,822 - $282,000
--
Bed
--
Bath
1,770
Sq Ft
$155/Sq Ft
Est. Value
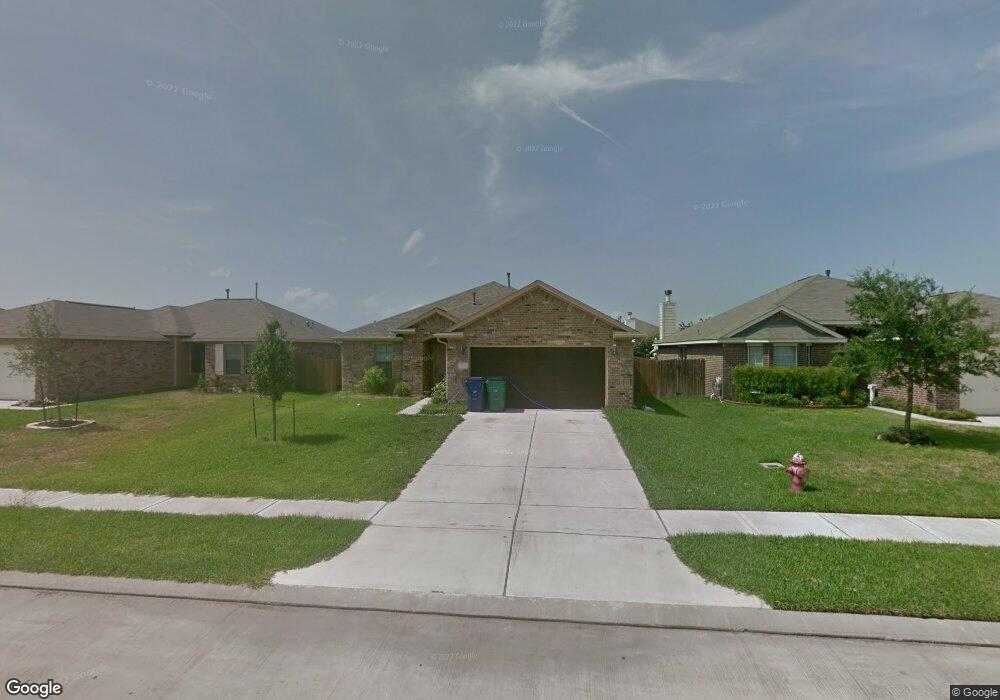
About This Home
This home is located at 385 Henry St, Alvin, TX 77511 and is currently estimated at $274,456, approximately $155 per square foot. 385 Henry St is a home located in Brazoria County with nearby schools including G.W. Harby Junior High School, Alvin High School, and Living Stones Christian School.
Ownership History
Date
Name
Owned For
Owner Type
Purchase Details
Closed on
Sep 20, 2018
Sold by
Aziz Masood and Aziz Avesha Masood
Bought by
Cervantes Octavio and Lopez Jheybi J
Current Estimated Value
Home Financials for this Owner
Home Financials are based on the most recent Mortgage that was taken out on this home.
Original Mortgage
$115,000
Outstanding Balance
$70,814
Interest Rate
4.5%
Mortgage Type
Purchase Money Mortgage
Estimated Equity
$203,642
Purchase Details
Closed on
Nov 29, 2010
Sold by
Grand View Builders Inc
Bought by
Aziz Masood and Aziz Ayesha Masood
Home Financials for this Owner
Home Financials are based on the most recent Mortgage that was taken out on this home.
Original Mortgage
$132,542
Interest Rate
4.23%
Mortgage Type
FHA
Create a Home Valuation Report for This Property
The Home Valuation Report is an in-depth analysis detailing your home's value as well as a comparison with similar homes in the area
Home Values in the Area
Average Home Value in this Area
Purchase History
| Date | Buyer | Sale Price | Title Company |
|---|---|---|---|
| Cervantes Octavio | -- | Alamo Title Co | |
| Aziz Masood | -- | Platinum Title Partners | |
| Grand View Builders Inc | -- | Platinum Title Partners |
Source: Public Records
Mortgage History
| Date | Status | Borrower | Loan Amount |
|---|---|---|---|
| Open | Cervantes Octavio | $115,000 | |
| Previous Owner | Aziz Masood | $132,542 |
Source: Public Records
Tax History Compared to Growth
Tax History
| Year | Tax Paid | Tax Assessment Tax Assessment Total Assessment is a certain percentage of the fair market value that is determined by local assessors to be the total taxable value of land and additions on the property. | Land | Improvement |
|---|---|---|---|---|
| 2025 | $4,918 | $282,120 | $27,830 | $254,290 |
| 2023 | $4,918 | $247,481 | $27,830 | $271,310 |
| 2022 | $6,171 | $224,983 | $26,710 | $213,760 |
| 2021 | $5,905 | $204,530 | $26,710 | $177,820 |
| 2020 | $5,889 | $201,210 | $26,710 | $174,500 |
| 2019 | $5,662 | $188,510 | $22,260 | $166,250 |
| 2018 | $2,786 | $92,575 | $11,130 | $81,445 |
| 2017 | $2,666 | $87,485 | $11,130 | $76,355 |
| 2016 | $2,084 | $68,395 | $11,130 | $57,265 |
| 2014 | $1,825 | $58,725 | $11,130 | $47,595 |
Source: Public Records
Map
Nearby Homes
- 394 De Coster Blvd
- 417 De Coster Blvd
- 5321 Latigo Ct
- 5323 Latigo Ct
- 5318 Latigo Ct
- The Princeton II Plan at Kendall Lakes
- The Crawford Plan at Kendall Lakes
- The Davenport II Plan at Kendall Lakes
- The Georgetown II Plan at Kendall Lakes
- The Pearson Plan at Kendall Lakes
- The James Plan at Kendall Lakes
- The McGinnis Plan at Kendall Lakes
- Madison Plan at Kendall Lakes
- Avery Plan at Kendall Lakes
- Elias Plan at Skyview
- Christina Plan at Kendall Lakes
- Rev Plan at Skyview
- Trenton Plan at Kendall Lakes
- 5320 Latigo Ct
- Cleo Plan at Skyview