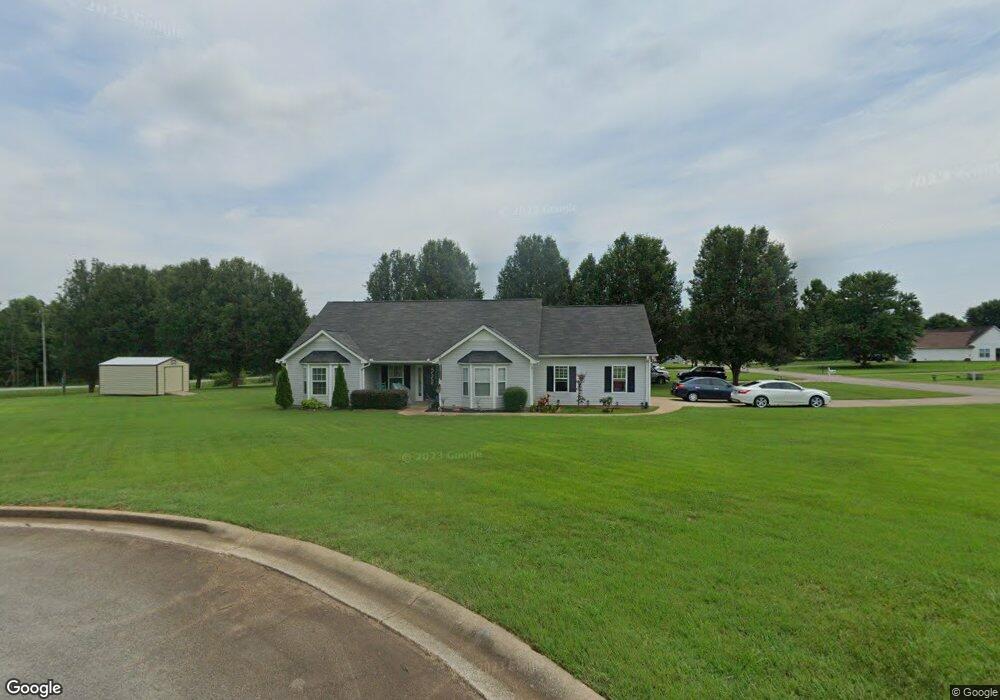
385 Kay Dr Unit 1 Winder, GA 30680
Estimated Value: $330,093 - $350,000
3
Beds
2
Baths
1,754
Sq Ft
$193/Sq Ft
Est. Value
About This Home
This home is located at 385 Kay Dr Unit 1, Winder, GA 30680 and is currently estimated at $339,023, approximately $193 per square foot. 385 Kay Dr Unit 1 is a home located in Barrow County with nearby schools including Holsenbeck Elementary School, Bear Creek Middle School, and Winder-Barrow High School.
Ownership History
Date
Name
Owned For
Owner Type
Purchase Details
Closed on
Jul 17, 1998
Sold by
Construct New Castle
Bought by
Cochran Gregory P
Current Estimated Value
Home Financials for this Owner
Home Financials are based on the most recent Mortgage that was taken out on this home.
Original Mortgage
$10,000
Interest Rate
6.94%
Mortgage Type
Stand Alone Refi Refinance Of Original Loan
Purchase Details
Closed on
Mar 13, 1998
Sold by
Patterson Phillip R and Patterson Brenda E
Bought by
Patterson Dennis
Home Financials for this Owner
Home Financials are based on the most recent Mortgage that was taken out on this home.
Original Mortgage
$78,320
Interest Rate
7.07%
Mortgage Type
New Conventional
Purchase Details
Closed on
May 22, 1980
Bought by
Patterson Ray and Patterson Bren
Create a Home Valuation Report for This Property
The Home Valuation Report is an in-depth analysis detailing your home's value as well as a comparison with similar homes in the area
Home Values in the Area
Average Home Value in this Area
Purchase History
| Date | Buyer | Sale Price | Title Company |
|---|---|---|---|
| Cochran Gregory P | $99,500 | -- | |
| Patterson Dennis | $15,000 | -- | |
| Patterson Ray | -- | -- |
Source: Public Records
Mortgage History
| Date | Status | Borrower | Loan Amount |
|---|---|---|---|
| Closed | Cochran Gregory P | $10,000 | |
| Previous Owner | Patterson Dennis | $78,320 | |
| Closed | Cochran Gregory P | -- |
Source: Public Records
Tax History Compared to Growth
Tax History
| Year | Tax Paid | Tax Assessment Tax Assessment Total Assessment is a certain percentage of the fair market value that is determined by local assessors to be the total taxable value of land and additions on the property. | Land | Improvement |
|---|---|---|---|---|
| 2024 | $2,516 | $99,878 | $24,000 | $75,878 |
| 2023 | $2,371 | $81,632 | $18,000 | $63,632 |
| 2022 | $1,810 | $61,145 | $16,000 | $45,145 |
| 2021 | $1,908 | $61,145 | $16,000 | $45,145 |
| 2020 | $1,912 | $61,145 | $16,000 | $45,145 |
| 2019 | $1,946 | $61,145 | $16,000 | $45,145 |
| 2018 | $1,744 | $55,200 | $12,000 | $43,200 |
| 2017 | $1,233 | $42,346 | $12,000 | $30,346 |
| 2016 | $1,363 | $43,068 | $12,000 | $31,068 |
| 2015 | $1,380 | $43,429 | $12,000 | $31,429 |
| 2014 | $1,246 | $37,670 | $5,880 | $31,790 |
| 2013 | -- | $35,808 | $5,880 | $29,928 |
Source: Public Records
Map
Nearby Homes
- 388 Kay Dr Unit 1
- 504 Stoney Creek Dr
- 419 Pleasant Hill Church Rd NE
- 1014 Brynn Dr
- 508 Pleasant Hill Church Rd NE
- 1553 Shoal Creek Dr
- 1228 Highway 211 NE
- 1228 Georgia Highway 211
- 380 Glenn Trail
- 1212 Highway 211 NE
- 1226 Highway 211 NE
- 883 Windward Rd
- 0 Hancock Bridge Rd Unit 10535063
- 63 Delightful Way Unit 1
- 130 (Tract 1) Bowman Mill Rd NE
- 130 Bowman Mill Rd NE Unit 1
- 203 Delightful Way Unit 5
- 206 Ballast Trail
- 253 Delightful Way Unit 6
- 230 Delightful Way Unit 23
- 1052 Taylor Ct Unit 2
- 387 Kay Dr Unit 1
- 387 Kay Dr
- 0 Taylor Ct Unit 3198297
- 0 Taylor Ct Unit 3212585
- 0 Taylor Ct Unit 7225229
- 0 Taylor Ct Unit 7505724
- 0 Taylor Ct
- 1054 Taylor Ct Unit 2
- 381 Kay Dr Unit 1
- 386 Kay Dr
- 386 Kay Dr
- 1053 Taylor Ct
- 384 Kay Dr Unit 1
- 1056 Taylor Ct Unit 24
- 1056 Taylor Ct Unit 2
- 1056 Taylor Ct
- 382 Kay Dr Unit 1
- 715 Taylor Ct Unit 20
- 379 Kay Dr Unit 1