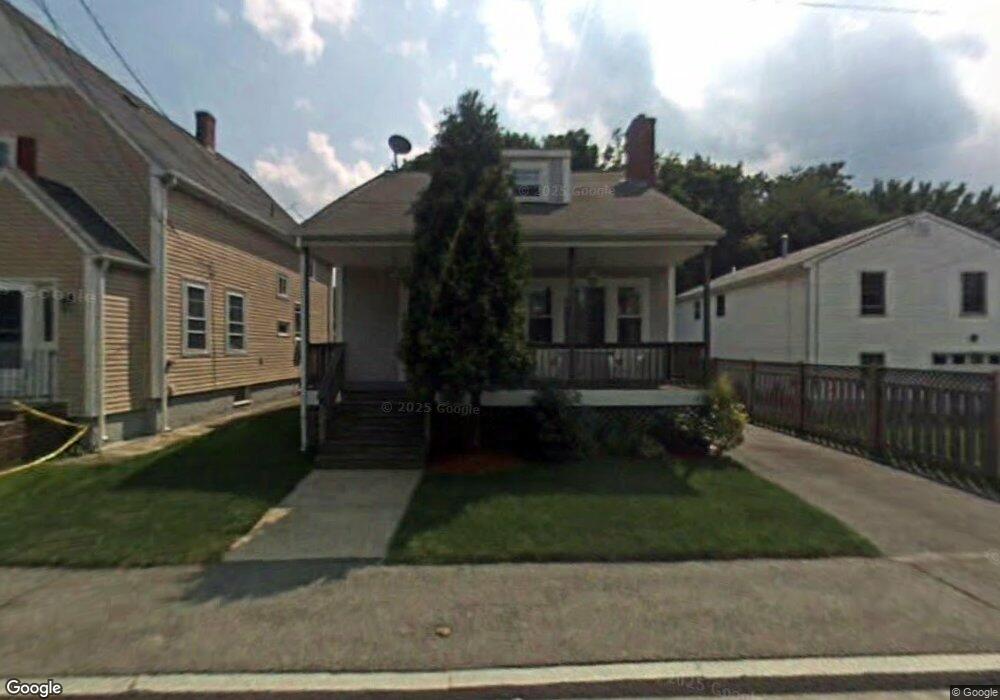
385 Massasoit Ave East Providence, RI 02914
Estimated Value: $415,000 - $486,000
4
Beds
2
Baths
2,300
Sq Ft
$196/Sq Ft
Est. Value
About This Home
This home is located at 385 Massasoit Ave, East Providence, RI 02914 and is currently estimated at $450,252, approximately $195 per square foot. 385 Massasoit Ave is a home located in Providence County with nearby schools including East Providence High School, Ocean State Montessori School, and St Margaret School.
Ownership History
Date
Name
Owned For
Owner Type
Purchase Details
Closed on
Apr 22, 1999
Sold by
Silva David G
Bought by
Jackson Matthew T and Jackson Lisa Marie
Current Estimated Value
Home Financials for this Owner
Home Financials are based on the most recent Mortgage that was taken out on this home.
Original Mortgage
$109,100
Interest Rate
7.02%
Mortgage Type
Purchase Money Mortgage
Create a Home Valuation Report for This Property
The Home Valuation Report is an in-depth analysis detailing your home's value as well as a comparison with similar homes in the area
Home Values in the Area
Average Home Value in this Area
Purchase History
| Date | Buyer | Sale Price | Title Company |
|---|---|---|---|
| Jackson Matthew T | $110,000 | -- | |
| Jackson Matthew T | $110,000 | -- |
Source: Public Records
Mortgage History
| Date | Status | Borrower | Loan Amount |
|---|---|---|---|
| Open | Jackson Matthew T | $252,000 | |
| Closed | Jackson Matthew T | $30,000 | |
| Closed | Jackson Matthew T | $186,000 | |
| Closed | Jackson Matthew T | $109,100 |
Source: Public Records
Tax History Compared to Growth
Tax History
| Year | Tax Paid | Tax Assessment Tax Assessment Total Assessment is a certain percentage of the fair market value that is determined by local assessors to be the total taxable value of land and additions on the property. | Land | Improvement |
|---|---|---|---|---|
| 2025 | $5,500 | $420,800 | $111,400 | $309,400 |
| 2024 | $5,047 | $329,200 | $92,800 | $236,400 |
| 2023 | $4,859 | $329,200 | $92,800 | $236,400 |
| 2022 | $4,617 | $211,200 | $44,000 | $167,200 |
| 2021 | $4,541 | $211,200 | $44,000 | $167,200 |
| 2020 | $4,349 | $211,200 | $44,000 | $167,200 |
| 2019 | $4,228 | $211,200 | $44,000 | $167,200 |
| 2018 | $4,134 | $180,700 | $44,500 | $136,200 |
| 2017 | $4,042 | $180,700 | $44,500 | $136,200 |
| 2016 | $4,022 | $180,700 | $44,500 | $136,200 |
| 2015 | $3,883 | $169,200 | $41,200 | $128,000 |
| 2014 | $3,883 | $169,200 | $41,200 | $128,000 |
Source: Public Records
Map
Nearby Homes
- 30 Metacomet Ave
- 200 Woodward Ave
- 270 Woodward Ave
- 674 N Broadway
- 115 Sutton Ave
- 56 Irving Ave
- 54 Dalton St
- 120 Williams Ave
- 172 Ivy St
- 13 Central Ave
- 125 Roger Williams Ave
- 30 Riverwoods Ct
- 141 E Point Dr Unit 401
- 141 E Point Dr Unit 105
- 141 E Point Dr Unit 306
- 141 E Point Dr Unit 103
- 141 E Point Dr Unit 406
- 141 E Point Dr Unit 113
- 130 E Point Dr
- 141 E Point Dr Unit 108
- 391 Massasoit Ave
- 397 Massasoit Ave
- 401 Massasoit Ave
- 40 Austin Ave Unit 42
- 34 Austin Ave
- 411 Massasoit Ave
- 50 Austin Ave
- 379 Massasoit Ave
- 0 Austin Ave
- 404 Massasoit Ave
- 56 Austin Ave
- 22 Austin Ave
- 361 Massasoit Ave
- 415 Massasoit Ave
- 39 Austin Ave
- 412 Massasoit Ave
- 62 Austin Ave
- 359 Massasoit Ave
- 27 Austin Ave
- 35 Austin Ave