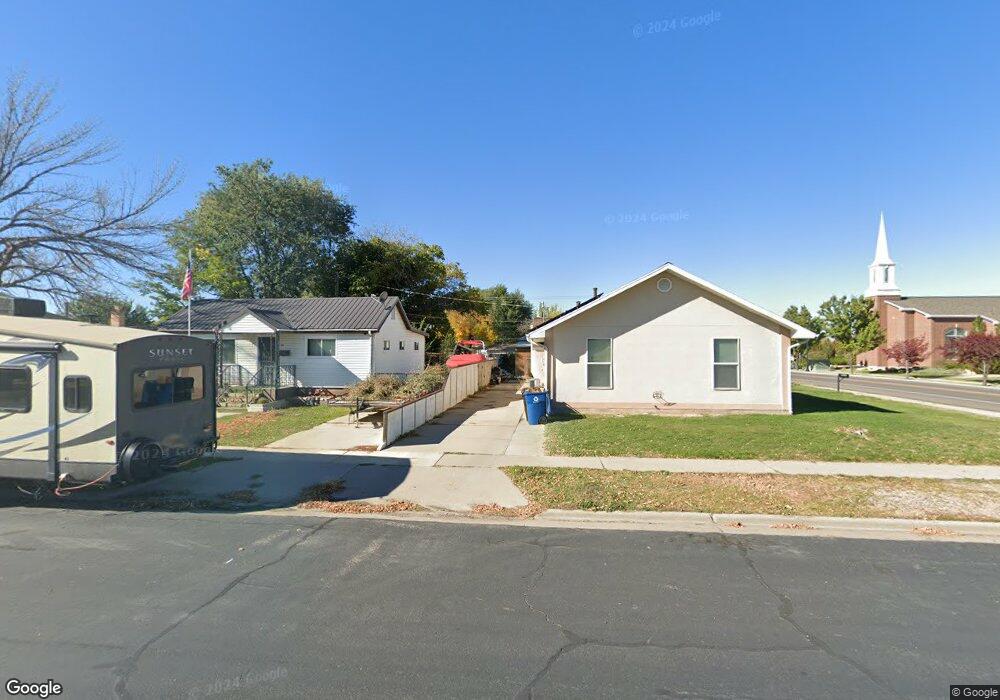
385 N 400 E Unit 29 Spanish Fork, UT 84660
Estimated Value: $680,000 - $825,722
4
Beds
3
Baths
4,873
Sq Ft
$157/Sq Ft
Est. Value
About This Home
This home is located at 385 N 400 E Unit 29, Spanish Fork, UT 84660 and is currently estimated at $766,574, approximately $157 per square foot. 385 N 400 E Unit 29 is a home located in Utah County with nearby schools including Park Elementary School, Spanish Fork Jr High School, and Spanish Fork High School.
Ownership History
Date
Name
Owned For
Owner Type
Purchase Details
Closed on
Nov 5, 2021
Sold by
Robert Gordon
Bought by
Gordon Robert C and Gordon Jennifer B
Current Estimated Value
Home Financials for this Owner
Home Financials are based on the most recent Mortgage that was taken out on this home.
Original Mortgage
$625,000
Outstanding Balance
$572,705
Interest Rate
2.99%
Mortgage Type
New Conventional
Estimated Equity
$193,869
Purchase Details
Closed on
Nov 4, 2021
Sold by
Mitchco Enterprises Llc
Bought by
Gordon Robert
Home Financials for this Owner
Home Financials are based on the most recent Mortgage that was taken out on this home.
Original Mortgage
$625,000
Outstanding Balance
$572,705
Interest Rate
2.99%
Mortgage Type
New Conventional
Estimated Equity
$193,869
Purchase Details
Closed on
Jun 26, 2018
Sold by
Brunson Duane and Brunson Jolynne
Bought by
Mitchco Enterprises Llc
Create a Home Valuation Report for This Property
The Home Valuation Report is an in-depth analysis detailing your home's value as well as a comparison with similar homes in the area
Home Values in the Area
Average Home Value in this Area
Purchase History
| Date | Buyer | Sale Price | Title Company |
|---|---|---|---|
| Gordon Robert C | -- | Accommodation/Courtesy Recordi | |
| Gordon Robert | -- | Wasatch Land & Title | |
| Mitchco Enterprises Llc | -- | Key Land Title |
Source: Public Records
Mortgage History
| Date | Status | Borrower | Loan Amount |
|---|---|---|---|
| Open | Gordon Robert C | $625,000 | |
| Closed | Gordon Robert | $625,000 |
Source: Public Records
Tax History
| Year | Tax Paid | Tax Assessment Tax Assessment Total Assessment is a certain percentage of the fair market value that is determined by local assessors to be the total taxable value of land and additions on the property. | Land | Improvement |
|---|---|---|---|---|
| 2025 | $3,288 | $407,495 | -- | -- |
| 2024 | $3,288 | $338,855 | $0 | $0 |
| 2023 | $3,449 | $355,850 | $0 | $0 |
| 2022 | $3,571 | $361,350 | $0 | $0 |
| 2021 | $1,441 | $128,300 | $128,300 | $0 |
| 2020 | $1,347 | $116,600 | $116,600 | $0 |
| 2019 | $1,202 | $109,500 | $109,500 | $0 |
| 2018 | $1,084 | $95,400 | $95,400 | $0 |
| 2017 | $986 | $84,800 | $0 | $0 |
| 2016 | $974 | $82,700 | $0 | $0 |
| 2015 | $986 | $82,700 | $0 | $0 |
Source: Public Records
Map
Nearby Homes
Your Personal Tour Guide
Ask me questions while you tour the home.