Estimated Value: $338,000 - $436,000
--
Bed
--
Bath
1,092
Sq Ft
$357/Sq Ft
Est. Value
About This Home
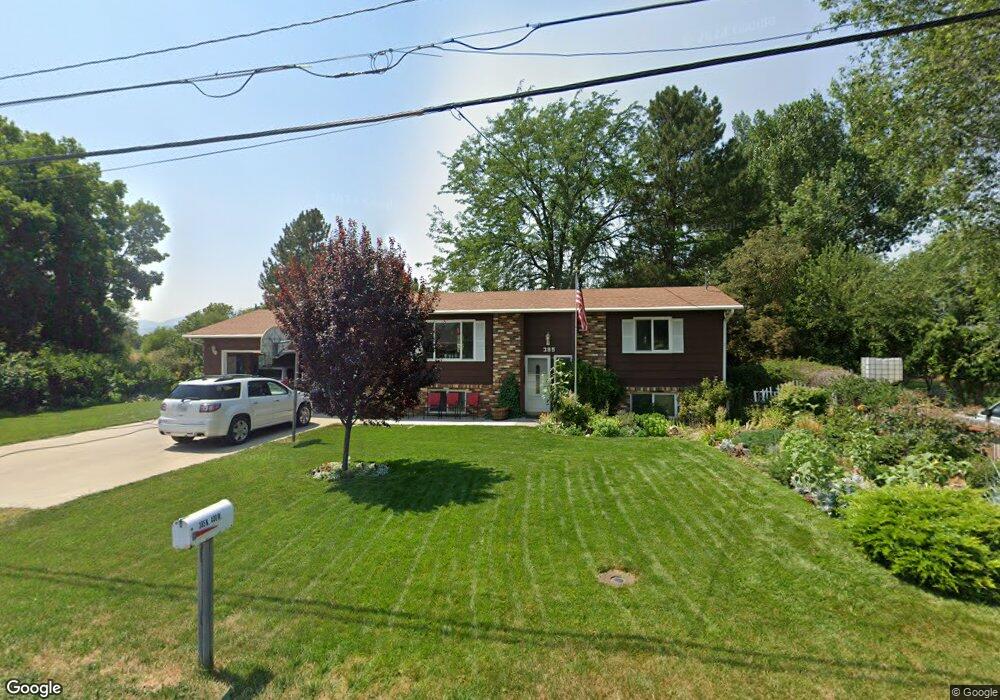
This home is located at 385 N 400 W, Hyrum, UT 84319 and is currently estimated at $389,433, approximately $356 per square foot. 385 N 400 W is a home with nearby schools including Lincoln School, South Cache Middle School, and Mountain Crest High School.
Ownership History
Date
Name
Owned For
Owner Type
Purchase Details
Closed on
May 17, 2001
Sold by
Barfus Bryan L and Barfus Alice A
Bought by
Barfus Bryan L and Barfus Alice A
Current Estimated Value
Home Financials for this Owner
Home Financials are based on the most recent Mortgage that was taken out on this home.
Original Mortgage
$93,600
Interest Rate
7.03%
Create a Home Valuation Report for This Property
The Home Valuation Report is an in-depth analysis detailing your home's value as well as a comparison with similar homes in the area
Home Values in the Area
Average Home Value in this Area
Purchase History
| Date | Buyer | Sale Price | Title Company |
|---|---|---|---|
| Barfus Bryan L | -- | American Secure Title |
Source: Public Records
Mortgage History
| Date | Status | Borrower | Loan Amount |
|---|---|---|---|
| Closed | Barfus Bryan L | $93,600 |
Source: Public Records
Tax History Compared to Growth
Tax History
| Year | Tax Paid | Tax Assessment Tax Assessment Total Assessment is a certain percentage of the fair market value that is determined by local assessors to be the total taxable value of land and additions on the property. | Land | Improvement |
|---|---|---|---|---|
| 2025 | $140 | $200,790 | $0 | $0 |
| 2024 | $1,490 | $199,835 | $0 | $0 |
| 2023 | $1,506 | $193,090 | $0 | $0 |
| 2022 | $1,572 | $193,085 | $0 | $0 |
| 2021 | $1,505 | $284,940 | $64,500 | $220,440 |
| 2020 | $1,397 | $248,200 | $64,500 | $183,700 |
| 2019 | $1,081 | $180,536 | $64,500 | $116,036 |
| 2018 | $853 | $137,836 | $39,500 | $98,336 |
| 2017 | $835 | $70,015 | $0 | $0 |
| 2016 | $854 | $70,015 | $0 | $0 |
| 2015 | $856 | $70,015 | $0 | $0 |
| 2014 | $810 | $67,700 | $0 | $0 |
| 2013 | -- | $66,965 | $0 | $0 |
Source: Public Records
Map
Nearby Homes