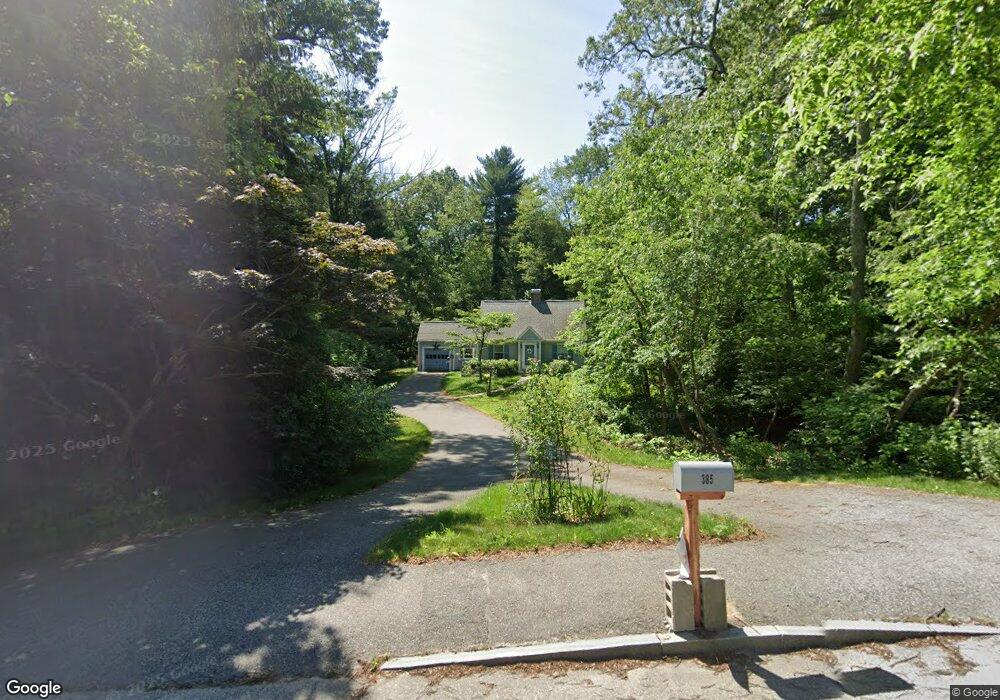
385 N Main St Sharon, MA 02067
Estimated Value: $593,000 - $768,000
2
Beds
2
Baths
1,208
Sq Ft
$538/Sq Ft
Est. Value
About This Home
This home is located at 385 N Main St, Sharon, MA 02067 and is currently estimated at $649,927, approximately $538 per square foot. 385 N Main St is a home located in Norfolk County with nearby schools including East Elementary School, Sharon Middle School, and Sharon High School.
Ownership History
Date
Name
Owned For
Owner Type
Purchase Details
Closed on
Apr 15, 1998
Sold by
Osborne Gordon B
Bought by
Aga Inc
Current Estimated Value
Home Financials for this Owner
Home Financials are based on the most recent Mortgage that was taken out on this home.
Original Mortgage
$298,000
Outstanding Balance
$56,619
Interest Rate
7.11%
Mortgage Type
Purchase Money Mortgage
Estimated Equity
$593,308
Purchase Details
Closed on
Sep 19, 1991
Sold by
Stencel Eorge R
Bought by
Achorn Patricia Lee
Create a Home Valuation Report for This Property
The Home Valuation Report is an in-depth analysis detailing your home's value as well as a comparison with similar homes in the area
Home Values in the Area
Average Home Value in this Area
Purchase History
| Date | Buyer | Sale Price | Title Company |
|---|---|---|---|
| Aga Inc | $47,000 | -- | |
| Achorn Patricia Lee | $142,500 | -- |
Source: Public Records
Mortgage History
| Date | Status | Borrower | Loan Amount |
|---|---|---|---|
| Open | Achorn Patricia Lee | $91,500 | |
| Open | Achorn Patricia Lee | $298,000 | |
| Previous Owner | Achorn Patricia Lee | $125,000 | |
| Previous Owner | Achorn Patricia Lee | $127,000 |
Source: Public Records
Tax History Compared to Growth
Tax History
| Year | Tax Paid | Tax Assessment Tax Assessment Total Assessment is a certain percentage of the fair market value that is determined by local assessors to be the total taxable value of land and additions on the property. | Land | Improvement |
|---|---|---|---|---|
| 2025 | $9,053 | $517,900 | $361,200 | $156,700 |
| 2024 | $8,581 | $488,100 | $331,400 | $156,700 |
| 2023 | $8,414 | $452,600 | $309,800 | $142,800 |
| 2022 | $7,795 | $394,700 | $258,200 | $136,500 |
| 2021 | $7,449 | $364,600 | $235,700 | $128,900 |
| 2020 | $6,779 | $356,800 | $227,900 | $128,900 |
| 2019 | $6,597 | $339,900 | $211,000 | $128,900 |
| 2018 | $6,898 | $356,100 | $227,200 | $128,900 |
| 2017 | $6,694 | $341,200 | $212,300 | $128,900 |
| 2016 | $6,634 | $329,900 | $212,300 | $117,600 |
| 2015 | $6,118 | $301,400 | $194,700 | $106,700 |
| 2014 | $5,657 | $275,300 | $177,100 | $98,200 |
Source: Public Records
Map
Nearby Homes
- 380 N Main St
- 4 Bayberry Dr Unit 3
- 40 Bayberry Dr Unit 1
- 3 Trowel Shop Pond Rd Unit 3
- 20 Trowel Shop Pond Rd Unit 24
- 16 Trowel Shop Pond Rd Unit 16
- 2 Trowel Shop Pond Rd Unit 2
- 8 Trowel Shop Pond Rd Unit 8
- 12 Trowel Shop Pond Rd Unit 12
- 24 Trowel Shop Pond Rd Unit 24
- 6 Trowel Shop Pond Rd Unit 6
- 212 Washington St
- 17 Donald Rd
- 29-31 Pond St
- 64 Highland St
- 12 Eastwood Rd
- 74 Ethyl Way
- 8 Patricia Dr
- 17 Patricia Dr
- 35 Patricia Dr