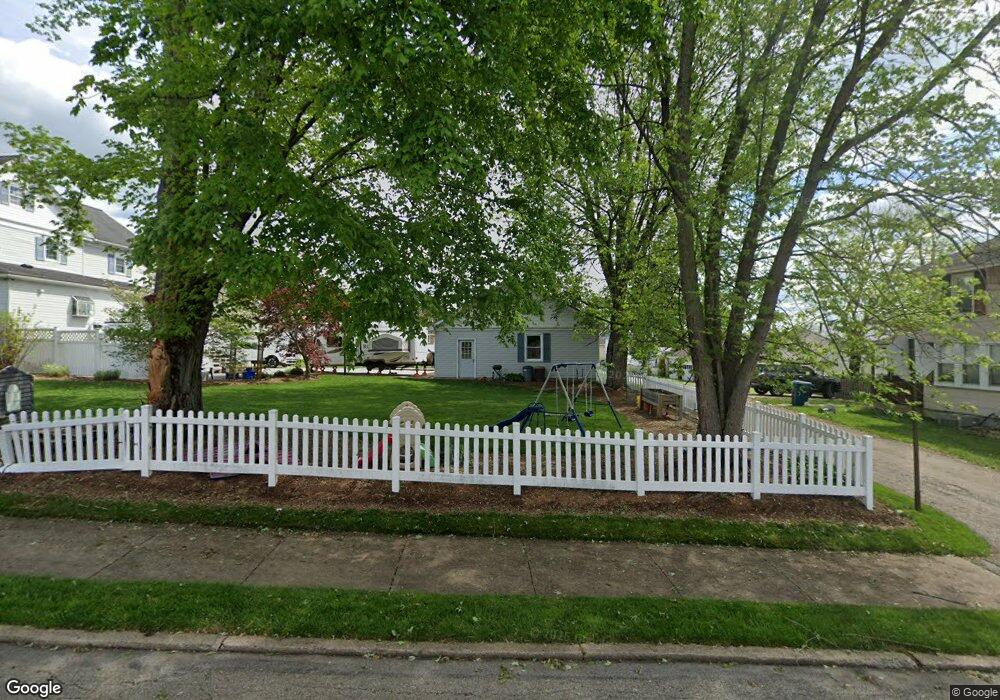
385 S Main St Homer City, PA 15748
Estimated Value: $137,000 - $173,000
3
Beds
1
Bath
1,904
Sq Ft
$79/Sq Ft
Est. Value
About This Home
This home is located at 385 S Main St, Homer City, PA 15748 and is currently estimated at $149,690, approximately $78 per square foot. 385 S Main St is a home located in Indiana County with nearby schools including Homer-Center Elementary School and Homer-Center Junior/Senior High School.
Ownership History
Date
Name
Owned For
Owner Type
Purchase Details
Closed on
Nov 6, 2009
Sold by
Roser Linda M
Bought by
Dunn Michael J and Dunn Krista A
Current Estimated Value
Home Financials for this Owner
Home Financials are based on the most recent Mortgage that was taken out on this home.
Original Mortgage
$17,970
Outstanding Balance
$11,740
Interest Rate
5.01%
Mortgage Type
Purchase Money Mortgage
Estimated Equity
$137,950
Create a Home Valuation Report for This Property
The Home Valuation Report is an in-depth analysis detailing your home's value as well as a comparison with similar homes in the area
Home Values in the Area
Average Home Value in this Area
Purchase History
| Date | Buyer | Sale Price | Title Company |
|---|---|---|---|
| Dunn Michael J | $119,800 | None Available |
Source: Public Records
Mortgage History
| Date | Status | Borrower | Loan Amount |
|---|---|---|---|
| Open | Dunn Michael J | $17,970 | |
| Open | Dunn Michael J | $95,840 |
Source: Public Records
Tax History Compared to Growth
Tax History
| Year | Tax Paid | Tax Assessment Tax Assessment Total Assessment is a certain percentage of the fair market value that is determined by local assessors to be the total taxable value of land and additions on the property. | Land | Improvement |
|---|---|---|---|---|
| 2025 | $2,697 | $95,900 | $11,200 | $84,700 |
| 2024 | $2,659 | $95,900 | $11,200 | $84,700 |
| 2023 | $2,518 | $95,900 | $11,200 | $84,700 |
| 2022 | $2,406 | $95,900 | $11,200 | $84,700 |
| 2021 | $2,406 | $95,900 | $11,200 | $84,700 |
| 2020 | $2,362 | $95,900 | $11,200 | $84,700 |
| 2018 | $2,349 | $95,900 | $11,200 | $84,700 |
| 2017 | $2,359 | $95,900 | $11,200 | $84,700 |
| 2016 | -- | $95,900 | $11,200 | $84,700 |
| 2015 | -- | $7,550 | $1,260 | $6,290 |
| 2014 | -- | $7,550 | $1,260 | $6,290 |
Source: Public Records
Map
Nearby Homes