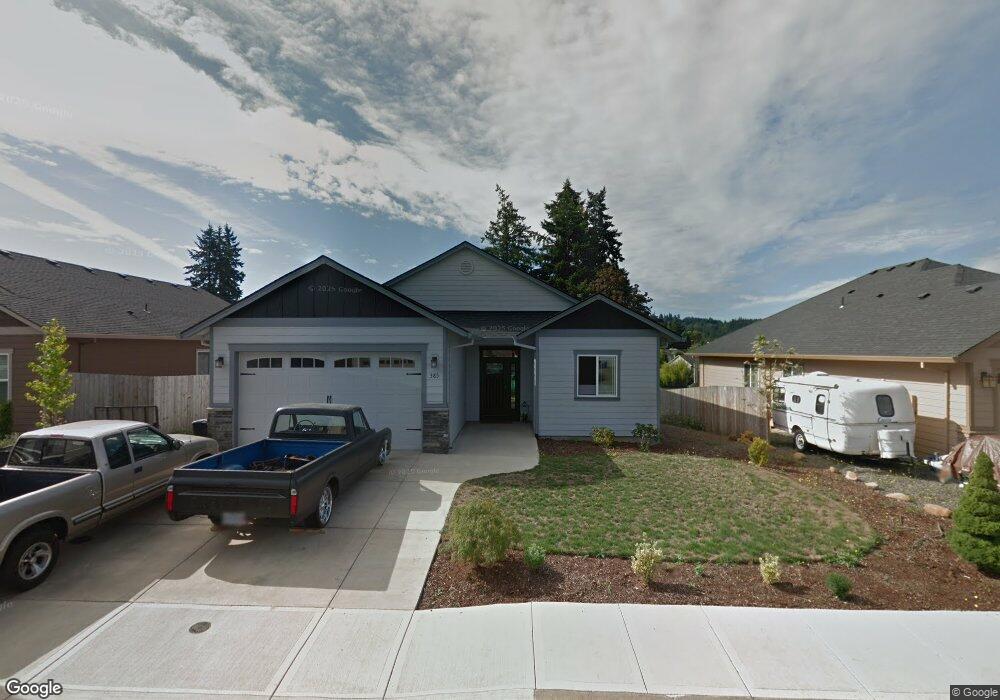
385 SE Regan Hill Loop Estacada, OR 97023
Estimated Value: $407,000 - $484,000
3
Beds
2
Baths
1,474
Sq Ft
$307/Sq Ft
Est. Value
About This Home
This home is located at 385 SE Regan Hill Loop, Estacada, OR 97023 and is currently estimated at $452,666, approximately $307 per square foot. 385 SE Regan Hill Loop is a home located in Clackamas County with nearby schools including Clackamas River Elementary School, Estacada Middle School, and Estacada High School.
Ownership History
Date
Name
Owned For
Owner Type
Purchase Details
Closed on
Aug 6, 2024
Sold by
Pharris Katherine
Bought by
Katherine E Pharris Revocable Living Trust and Pharris
Current Estimated Value
Purchase Details
Closed on
May 4, 2012
Sold by
Crestwood Homes Llc
Bought by
Pharris Terry and Cain Katherine
Home Financials for this Owner
Home Financials are based on the most recent Mortgage that was taken out on this home.
Original Mortgage
$192,857
Interest Rate
4.05%
Mortgage Type
New Conventional
Create a Home Valuation Report for This Property
The Home Valuation Report is an in-depth analysis detailing your home's value as well as a comparison with similar homes in the area
Home Values in the Area
Average Home Value in this Area
Purchase History
| Date | Buyer | Sale Price | Title Company |
|---|---|---|---|
| Katherine E Pharris Revocable Living Trust | -- | None Listed On Document | |
| Pharris Terry | $189,000 | First American | |
| Crestwood Homes Llc | $26,500 | First American |
Source: Public Records
Mortgage History
| Date | Status | Borrower | Loan Amount |
|---|---|---|---|
| Previous Owner | Pharris Terry | $192,857 |
Source: Public Records
Tax History
| Year | Tax Paid | Tax Assessment Tax Assessment Total Assessment is a certain percentage of the fair market value that is determined by local assessors to be the total taxable value of land and additions on the property. | Land | Improvement |
|---|---|---|---|---|
| 2025 | $3,635 | $247,943 | -- | -- |
| 2024 | $3,776 | $240,722 | -- | -- |
| 2023 | $3,776 | $233,711 | $0 | $0 |
| 2022 | $3,590 | $226,904 | $0 | $0 |
| 2021 | $3,497 | $220,296 | $0 | $0 |
| 2020 | $3,367 | $213,880 | $0 | $0 |
| 2019 | $3,319 | $207,651 | $0 | $0 |
| 2018 | $3,243 | $201,603 | $0 | $0 |
| 2017 | $3,105 | $195,731 | $0 | $0 |
| 2016 | $3,077 | $190,030 | $0 | $0 |
Source: Public Records
Map
Nearby Homes
- 305 SE Oak View Ln
- 1200 SE Regan Hill Loop
- 462 SE Dance Dr
- 585 SE 4th Ave
- 297 NE Regan Hill Loop
- 32953 SE Darrow Rd
- 1057 NE Regan Hill Loop
- 115 NE Megan Dr
- 203 SE Ginseng Dr
- 1066 NE Regan Hill Loop
- 886 SE Bonnie Burke Dr
- 737 SE Forest Glen Rd
- 518 SE Espinosa St
- 995 SE Olive Way
- 743 SE Forest Glen Rd
- 1041 SE Olive Way
- 186 NE Shafford Ave
- 33900 SE Coupland Rd
- 130 W 1st Ave
- 625 NE 6th Ave
- 383 SE Regan Hill Loop
- 389 SE Regan Hill Loop
- 381 SE Regan Hill Loop
- 391 SE Regan Hill Loop
- 850 SE 4th Ave
- 386 SE Regan Hill Loop
- 384 SE Regan Hill Loop
- 388 SE Regan Hill Loop
- 393 SE Regan Hill Loop
- 345 SE Regan Hill Loop
- 852 SE 4th Ave
- 392 SE Regan Hill Loop
- 343 SE Regan Hill Loop
- 761 SE 4th Ave
- 14 Mountain View Ln
- 395 SE Regan Hill Loop
- 341 SE Regan Hill Loop
- 900 SE Pineview Ct
- 394 SE Regan Hill Loop
Your Personal Tour Guide
Ask me questions while you tour the home.