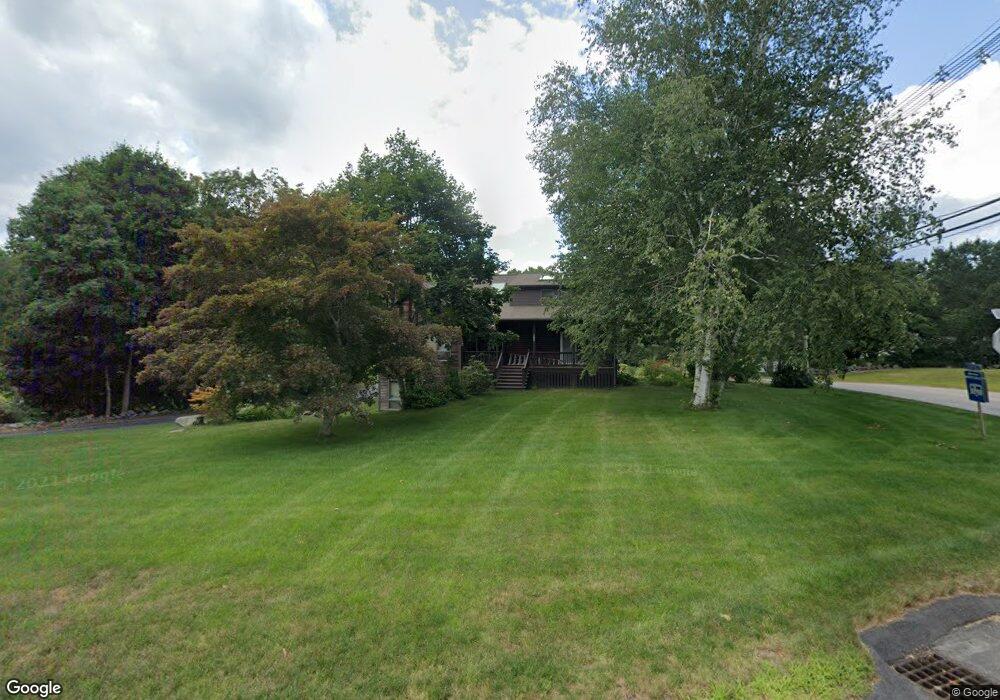
385 South St Foxboro, MA 02035
Estimated Value: $927,295 - $1,016,000
3
Beds
3
Baths
3,348
Sq Ft
$290/Sq Ft
Est. Value
About This Home
This home is located at 385 South St, Foxboro, MA 02035 and is currently estimated at $972,074, approximately $290 per square foot. 385 South St is a home located in Norfolk County with nearby schools including Foxborough High School, Foxborough Regional Charter School, and Hands-On-Montessori School.
Create a Home Valuation Report for This Property
The Home Valuation Report is an in-depth analysis detailing your home's value as well as a comparison with similar homes in the area
Home Values in the Area
Average Home Value in this Area
Tax History Compared to Growth
Tax History
| Year | Tax Paid | Tax Assessment Tax Assessment Total Assessment is a certain percentage of the fair market value that is determined by local assessors to be the total taxable value of land and additions on the property. | Land | Improvement |
|---|---|---|---|---|
| 2025 | $9,957 | $753,200 | $210,300 | $542,900 |
| 2024 | $9,230 | $683,200 | $226,600 | $456,600 |
| 2023 | $8,816 | $620,400 | $215,800 | $404,600 |
| 2022 | $8,583 | $591,100 | $193,400 | $397,700 |
| 2021 | $7,996 | $542,500 | $183,700 | $358,800 |
| 2020 | $7,904 | $542,500 | $183,700 | $358,800 |
| 2019 | $7,991 | $543,600 | $184,300 | $359,300 |
| 2018 | $7,171 | $492,200 | $175,000 | $317,200 |
| 2017 | $7,269 | $483,300 | $172,100 | $311,200 |
| 2016 | $7,170 | $483,800 | $165,800 | $318,000 |
| 2015 | $6,870 | $452,300 | $123,500 | $328,800 |
| 2014 | $6,672 | $445,100 | $123,500 | $321,600 |
Source: Public Records
Map
Nearby Homes
- 12 West St
- 80 Mill St
- 16 Bradner St
- 33 Treasure Island Rd
- 115 S High St
- 9 Oak Dr
- 483 Thurston St
- 24 Red Coat Ln
- 450 West St
- 356 Central St
- 8 Howard Ave
- 56B Taunton St
- 4 Buckskin Dr
- 14 Baker St
- 130 Washington St
- 126 Washington St
- 124 Washington St
- 160 Washington St Unit 44
- 160 Washington St Unit 65
- 160 Washington St Unit 36