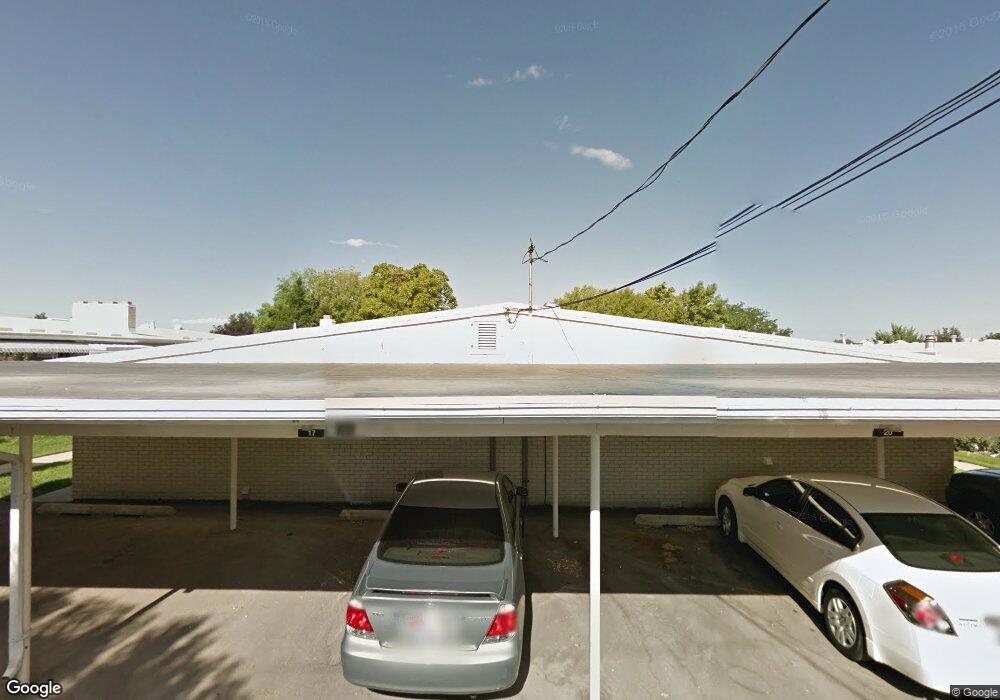
385 W 400 N Unit 17 Bountiful, UT 84010
Estimated Value: $293,000 - $336,000
2
Beds
1
Bath
1,421
Sq Ft
$222/Sq Ft
Est. Value
About This Home
This home is located at 385 W 400 N Unit 17, Bountiful, UT 84010 and is currently estimated at $315,316, approximately $221 per square foot. 385 W 400 N Unit 17 is a home located in Davis County with nearby schools including Meadowbrook Elementary School, Bountiful Junior High School, and Bountiful High School.
Ownership History
Date
Name
Owned For
Owner Type
Purchase Details
Closed on
Mar 6, 2023
Sold by
Bishop Richard B
Bought by
Storm Michael Glen
Current Estimated Value
Home Financials for this Owner
Home Financials are based on the most recent Mortgage that was taken out on this home.
Original Mortgage
$270,750
Outstanding Balance
$261,944
Interest Rate
6.13%
Mortgage Type
New Conventional
Estimated Equity
$53,372
Purchase Details
Closed on
Mar 27, 2013
Sold by
Schwartz Justyne
Bought by
Bishop Richard B
Home Financials for this Owner
Home Financials are based on the most recent Mortgage that was taken out on this home.
Original Mortgage
$92,000
Interest Rate
3.47%
Mortgage Type
New Conventional
Purchase Details
Closed on
Oct 20, 1998
Sold by
Davies Dean
Bought by
Schwartz Justyne
Purchase Details
Closed on
Jan 20, 1998
Sold by
Davies Myra B
Bought by
Davies Myra B and The Myra B Davies Family Trust
Create a Home Valuation Report for This Property
The Home Valuation Report is an in-depth analysis detailing your home's value as well as a comparison with similar homes in the area
Home Values in the Area
Average Home Value in this Area
Purchase History
| Date | Buyer | Sale Price | Title Company |
|---|---|---|---|
| Storm Michael Glen | -- | First American Title | |
| Bishop Richard B | -- | North American Title L | |
| Schwartz Justyne | -- | Equity Title Agency | |
| Davies Myra B | -- | Equity Title Agency |
Source: Public Records
Mortgage History
| Date | Status | Borrower | Loan Amount |
|---|---|---|---|
| Open | Storm Michael Glen | $270,750 | |
| Previous Owner | Bishop Richard B | $92,000 |
Source: Public Records
Tax History Compared to Growth
Tax History
| Year | Tax Paid | Tax Assessment Tax Assessment Total Assessment is a certain percentage of the fair market value that is determined by local assessors to be the total taxable value of land and additions on the property. | Land | Improvement |
|---|---|---|---|---|
| 2025 | $1,527 | $141,900 | $48,950 | $92,950 |
| 2024 | $1,473 | $139,700 | $54,450 | $85,250 |
| 2023 | $1,446 | $136,950 | $51,150 | $85,800 |
| 2022 | $1,346 | $126,500 | $32,450 | $94,050 |
| 2021 | $1,398 | $202,000 | $46,000 | $156,000 |
| 2020 | $1,208 | $175,000 | $42,600 | $132,400 |
| 2019 | $1,136 | $160,000 | $39,000 | $121,000 |
| 2018 | $1,041 | $144,000 | $55,000 | $89,000 |
| 2016 | $797 | $59,125 | $13,750 | $45,375 |
| 2015 | $733 | $50,945 | $13,750 | $37,195 |
| 2014 | $910 | $66,417 | $18,333 | $48,084 |
| 2013 | -- | $65,648 | $17,600 | $48,048 |
Source: Public Records
Map
Nearby Homes
- 399 W 400 N Unit 47
- 340 N 500 W Unit 204
- 155 N Peregrine Ln W
- 499 N 200 W Unit 30
- 499 N 200 W Unit 19
- 314 W Center St Unit D135
- 314 W Center St Unit D159
- 314 W Center St Unit E150
- 75 N Peregrine Ln W Unit 8
- 553 N 200 W
- 131 W 25 N Unit 4
- 147 W 25 N Unit 5
- 790 N 500 W
- 167 S 425 W
- 106 W 700 N
- 810 Park Shadows Cir
- 366 W 1000 N
- 184 Park Shadows Cir
- 252 N Main St
- 256 N Main St
- 385 W 400 N Unit 20
- 385 W 400 N Unit 19
- 385 W 400 N
- 385 W 400 N Unit 18
- 387 W 400 N Unit 24
- 387 W 400 N Unit 23
- 387 W 400 N Unit 22
- 387 W 400 N Unit 21
- 383 W 400 N Unit 16
- 383 W 400 N Unit 15
- 383 W 400 N Unit 14
- 383 W 400 N Unit 13
- 383 W 400 N
- 309 N 350 W
- 389 W 400 N Unit 28
- 389 W 400 N Unit 27
- 389 W 400 N Unit 26
- 389 W 400 N Unit 25
- 391 W 400 N Unit 32
- 391 W 400 N Unit 31