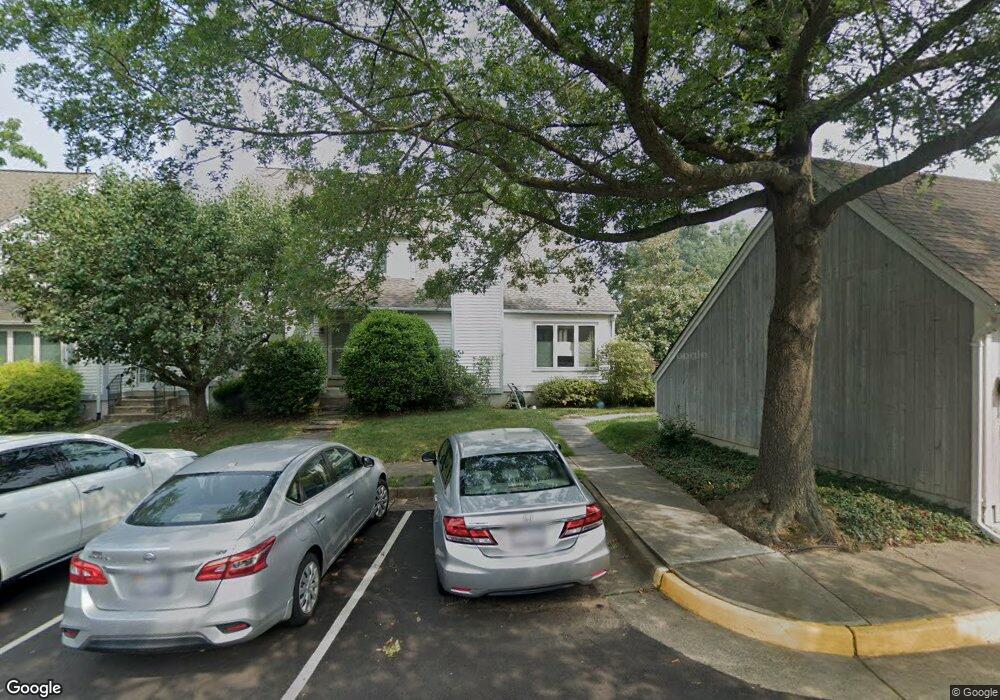
3850 Alder Woods Ct Fairfax, VA 22033
Estimated Value: $665,947 - $700,000
3
Beds
2
Baths
1,664
Sq Ft
$413/Sq Ft
Est. Value
About This Home
This home is located at 3850 Alder Woods Ct, Fairfax, VA 22033 and is currently estimated at $686,737, approximately $412 per square foot. 3850 Alder Woods Ct is a home located in Fairfax County with nearby schools including Navy Elementary, Franklin Middle, and Oakton High.
Ownership History
Date
Name
Owned For
Owner Type
Purchase Details
Closed on
Oct 4, 2005
Sold by
Woodard Stephen
Bought by
Schiefer James Edward
Current Estimated Value
Home Financials for this Owner
Home Financials are based on the most recent Mortgage that was taken out on this home.
Original Mortgage
$282,950
Outstanding Balance
$151,925
Interest Rate
5.81%
Mortgage Type
New Conventional
Estimated Equity
$534,812
Purchase Details
Closed on
Aug 29, 2000
Sold by
Moreau Timothy J
Bought by
Woodard Stephen
Home Financials for this Owner
Home Financials are based on the most recent Mortgage that was taken out on this home.
Original Mortgage
$164,250
Interest Rate
8.16%
Purchase Details
Closed on
Jun 9, 1997
Sold by
Vaughan Denton R
Bought by
Moreau Timothy J
Home Financials for this Owner
Home Financials are based on the most recent Mortgage that was taken out on this home.
Original Mortgage
$112,500
Interest Rate
7.98%
Mortgage Type
New Conventional
Create a Home Valuation Report for This Property
The Home Valuation Report is an in-depth analysis detailing your home's value as well as a comparison with similar homes in the area
Home Values in the Area
Average Home Value in this Area
Purchase History
| Date | Buyer | Sale Price | Title Company |
|---|---|---|---|
| Schiefer James Edward | $482,950 | -- | |
| Woodard Stephen | $182,500 | -- | |
| Moreau Timothy J | $150,000 | -- |
Source: Public Records
Mortgage History
| Date | Status | Borrower | Loan Amount |
|---|---|---|---|
| Open | Schiefer James Edward | $282,950 | |
| Previous Owner | Woodard Stephen | $164,250 | |
| Previous Owner | Moreau Timothy J | $112,500 |
Source: Public Records
Tax History Compared to Growth
Tax History
| Year | Tax Paid | Tax Assessment Tax Assessment Total Assessment is a certain percentage of the fair market value that is determined by local assessors to be the total taxable value of land and additions on the property. | Land | Improvement |
|---|---|---|---|---|
| 2025 | $6,487 | $586,080 | $200,000 | $386,080 |
| 2024 | $6,487 | $559,920 | $190,000 | $369,920 |
| 2023 | $6,234 | $552,430 | $190,000 | $362,430 |
| 2022 | $6,199 | $542,090 | $185,000 | $357,090 |
| 2021 | $5,663 | $482,550 | $155,000 | $327,550 |
| 2020 | $5,448 | $460,360 | $150,000 | $310,360 |
| 2019 | $5,360 | $452,860 | $145,000 | $307,860 |
| 2018 | $4,832 | $420,130 | $140,000 | $280,130 |
| 2017 | $4,544 | $391,380 | $130,000 | $261,380 |
| 2016 | $4,726 | $407,980 | $130,000 | $277,980 |
| 2015 | $4,305 | $385,770 | $125,000 | $260,770 |
| 2014 | $4,192 | $376,510 | $120,000 | $256,510 |
Source: Public Records
Map
Nearby Homes
- 3878 Alder Woods Ct
- 3861 Alder Woods Ct
- 12465 Blissful Valley Dr
- 3925 Fair Ridge Dr Unit 305
- 3925 Fair Ridge Dr Unit 304
- 4001 Middle Ridge Dr
- 3795 Rainier Dr
- 12608 Victoria Station Ct
- 4107 Quiet Crossing Ct
- 12820 Point Pleasant Dr
- 4107 Mount Echo Ln
- 4208 Mayport Ln
- 4111 Mount Echo Ln
- 4200 Maylock Ln
- 4009 Rosemeade Dr
- 12150 Wedgeway Ct
- 4024 Nicholas Ct
- 12975 Ridgemist Ln
- 12116 Greenway Ct Unit 202
- 3424 Tilton Valley Dr
- 3852 Alder Woods Ct
- 3854 Alder Woods Ct
- 3856 Alder Woods Ct
- 3853 Alder Woods Ct
- 3849 Alder Woods Ct
- 3851 Alder Woods Ct
- 3847 Alder Woods Ct
- 3855 Alder Woods Ct
- 3876 Alder Woods Ct
- 3857 Alder Woods Ct
- 3859 Alder Woods Ct
- 3863 Alder Woods Ct
- 3880 Alder Woods Ct
- 3865 Alder Woods Ct
- 12584 Garland Tree Ct
- 12582 Garland Tree Ct
- 12580 Garland Tree Ct
- 12578 Garland Tree Ct
- 12576 Garland Tree Ct
- 3867 Alder Woods Ct