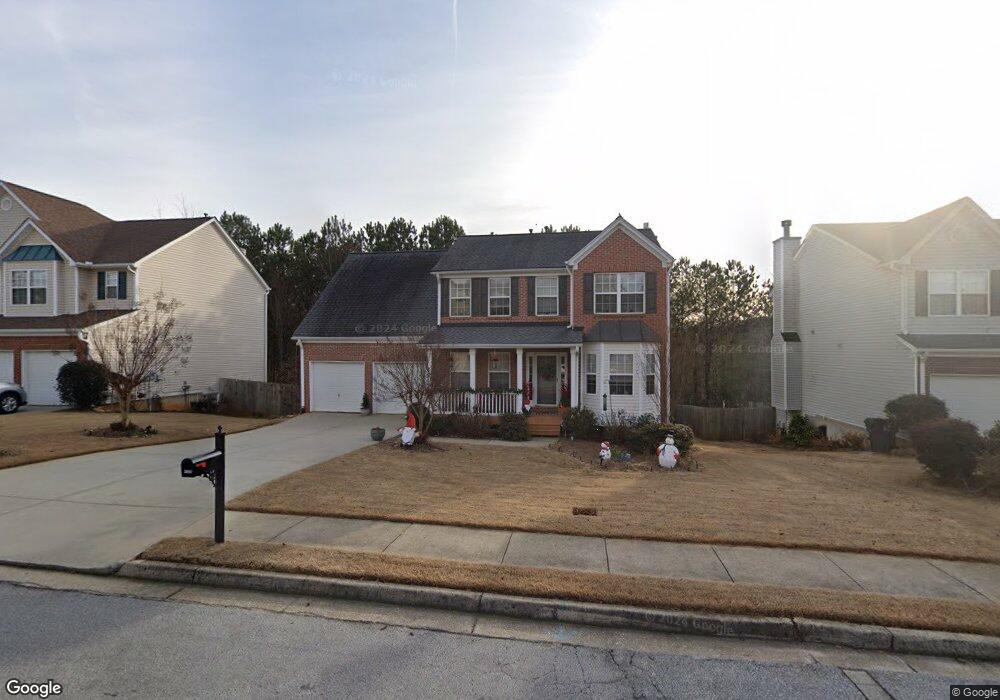
3850 Crescent Walk Ln NE Suwanee, GA 30024
Estimated Value: $520,000 - $546,828
4
Beds
3
Baths
2,208
Sq Ft
$241/Sq Ft
Est. Value
About This Home
This home is located at 3850 Crescent Walk Ln NE, Suwanee, GA 30024 and is currently estimated at $532,707, approximately $241 per square foot. 3850 Crescent Walk Ln NE is a home located in Gwinnett County with nearby schools including Roberts Elementary School, North Gwinnett Middle School, and North Gwinnett High School.
Ownership History
Date
Name
Owned For
Owner Type
Purchase Details
Closed on
Feb 28, 2024
Sold by
Joo Jin Hong
Bought by
Ran Jo Hye and Hong Joo Jin
Current Estimated Value
Home Financials for this Owner
Home Financials are based on the most recent Mortgage that was taken out on this home.
Original Mortgage
$240,000
Outstanding Balance
$222,607
Interest Rate
5.94%
Mortgage Type
New Conventional
Estimated Equity
$310,100
Purchase Details
Closed on
Feb 27, 2024
Sold by
Flack Simone
Bought by
Hong Joo Jin
Home Financials for this Owner
Home Financials are based on the most recent Mortgage that was taken out on this home.
Original Mortgage
$240,000
Outstanding Balance
$222,607
Interest Rate
5.94%
Mortgage Type
New Conventional
Estimated Equity
$310,100
Create a Home Valuation Report for This Property
The Home Valuation Report is an in-depth analysis detailing your home's value as well as a comparison with similar homes in the area
Home Values in the Area
Average Home Value in this Area
Purchase History
| Date | Buyer | Sale Price | Title Company |
|---|---|---|---|
| Ran Jo Hye | -- | -- | |
| Hong Joo Jin | $575,000 | -- |
Source: Public Records
Mortgage History
| Date | Status | Borrower | Loan Amount |
|---|---|---|---|
| Open | Ran Jo Hye | $240,000 |
Source: Public Records
Tax History Compared to Growth
Tax History
| Year | Tax Paid | Tax Assessment Tax Assessment Total Assessment is a certain percentage of the fair market value that is determined by local assessors to be the total taxable value of land and additions on the property. | Land | Improvement |
|---|---|---|---|---|
| 2025 | $6,306 | $177,520 | $33,600 | $143,920 |
| 2024 | $4,951 | $177,520 | $33,600 | $143,920 |
| 2023 | $4,951 | $187,800 | $33,600 | $154,200 |
| 2022 | $4,730 | $168,640 | $33,600 | $135,040 |
| 2021 | $3,705 | $116,200 | $23,160 | $93,040 |
| 2020 | $3,731 | $116,200 | $23,160 | $93,040 |
| 2019 | $3,633 | $116,200 | $23,160 | $93,040 |
| 2018 | $3,294 | $100,360 | $29,200 | $71,160 |
| 2016 | $3,127 | $91,640 | $24,800 | $66,840 |
| 2015 | $3,074 | $87,880 | $24,800 | $63,080 |
| 2014 | -- | $73,560 | $14,000 | $59,560 |
Source: Public Records
Map
Nearby Homes
- 3740 Crescent Walk Ln
- 3720 Crescent Walk Ln
- 3941 Oak Crossing Dr
- 3998 Oak Crossing Dr NE
- 665 Roxford Ln Unit 3
- 3612 Brookefall Ct
- 3720 Brookefall Landing
- 3805 Roxwood Park Dr Unit 1
- 812 Holly Meadow Dr
- 3725 Roxwood Park Dr Unit 1
- 4071 Woodward Walk Ln
- 358 Rhodes House Ct
- 3811 Roxfield Dr
- 407 Vista Lake Dr
- 3929 Two Bridge Dr
- 3713 Lake Edge Dr
- 4450 Woodward Walk Ln
- 4154 Hawking Dr
- 3850 Crescent Walk Ln
- 3840 Crescent Walk Ln
- 3860 Crescent
- 3860 Crescent Walk Ln
- 3865 Crescent Walk Ln
- 3870 Crescent Walk Ln
- 3830 Crescent Walk Ln
- 3785 Crescent Walk Ln
- 3775 Crescent Walk Ln
- 3875 Crescent Walk Ln
- 3820 Crescent Walk Ln
- 3880 Crescent Walk Ln Unit 20
- 3880 Crescent Walk Ln
- 3880 Crescent Walk Ln NE Unit 20
- 3880 Crescent Walk Ln NE
- 3765 Crescent Walk Ln
- 3885 Crescent Walk Ln
- 3901 Oak Crossing Dr
- 3755 Crescent Walk Ln
- 3790 Crescent Walk Ln NE