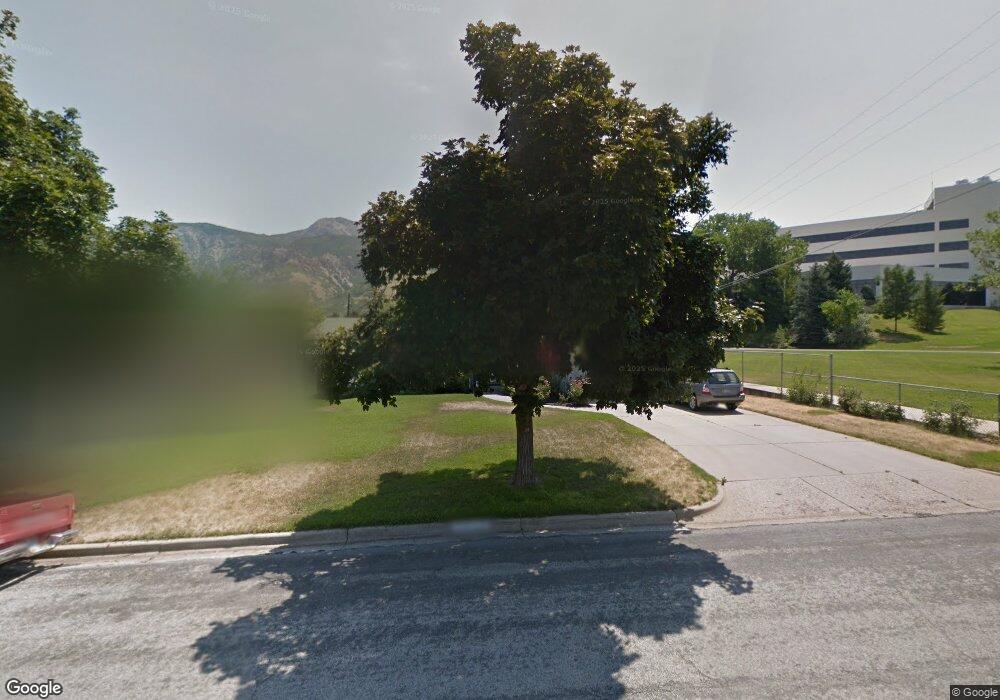
3850 Eccles Ave Ogden, UT 84403
Southeast Ogden NeighborhoodEstimated Value: $403,000 - $499,000
4
Beds
2
Baths
3,400
Sq Ft
$133/Sq Ft
Est. Value
About This Home
This home is located at 3850 Eccles Ave, Ogden, UT 84403 and is currently estimated at $451,676, approximately $132 per square foot. 3850 Eccles Ave is a home located in Weber County with nearby schools including Shadow Valley School, Mount Ogden Junior High School, and Ogden High School.
Ownership History
Date
Name
Owned For
Owner Type
Purchase Details
Closed on
Aug 15, 2018
Sold by
Poggemeyer Karen W
Bought by
Poggemeyer Karen W and The Karen W Poggemeyer Living
Current Estimated Value
Purchase Details
Closed on
Dec 22, 2008
Sold by
Hess Darren and Hess Julie
Bought by
Poggemeyer Lewis E and Poggemeyer Karen W
Home Financials for this Owner
Home Financials are based on the most recent Mortgage that was taken out on this home.
Original Mortgage
$85,000
Interest Rate
5.82%
Mortgage Type
Purchase Money Mortgage
Purchase Details
Closed on
May 10, 2007
Sold by
Stromberg Martha and Saunders Linda
Bought by
Hess Darren and Hess Julie
Purchase Details
Closed on
May 3, 2007
Sold by
Stromberg Martha Gay and Saunders Linda
Bought by
Stromberg Martha Gay and Saunders Linda
Purchase Details
Closed on
May 9, 2001
Sold by
Stromberg Elroy M and Stromberg Martha Gay
Bought by
Stromberg Martha Gay and Saunders Linda
Create a Home Valuation Report for This Property
The Home Valuation Report is an in-depth analysis detailing your home's value as well as a comparison with similar homes in the area
Home Values in the Area
Average Home Value in this Area
Purchase History
| Date | Buyer | Sale Price | Title Company |
|---|---|---|---|
| Poggemeyer Karen W | -- | None Available | |
| Poggemeyer Lewis E | -- | Weber Title | |
| Hess Darren | -- | Teton Title Insurance Agency | |
| Stromberg Martha Gay | -- | Teton Title Insurance Agency | |
| Stromberg Martha Gay | -- | -- |
Source: Public Records
Mortgage History
| Date | Status | Borrower | Loan Amount |
|---|---|---|---|
| Closed | Poggemeyer Lewis E | $85,000 |
Source: Public Records
Tax History
| Year | Tax Paid | Tax Assessment Tax Assessment Total Assessment is a certain percentage of the fair market value that is determined by local assessors to be the total taxable value of land and additions on the property. | Land | Improvement |
|---|---|---|---|---|
| 2025 | $3,262 | $420,611 | $136,387 | $284,224 |
| 2024 | $3,240 | $226,049 | $75,012 | $151,037 |
| 2023 | $3,169 | $224,400 | $66,141 | $158,259 |
| 2022 | $3,522 | $255,750 | $56,774 | $198,976 |
| 2021 | $2,607 | $304,000 | $63,034 | $240,966 |
| 2020 | $2,421 | $259,000 | $47,416 | $211,584 |
| 2019 | $2,359 | $236,000 | $42,574 | $193,426 |
| 2018 | $2,111 | $207,000 | $37,495 | $169,505 |
| 2017 | $1,956 | $177,000 | $37,495 | $139,505 |
| 2016 | $1,810 | $87,668 | $17,260 | $70,408 |
| 2015 | $1,726 | $81,239 | $17,260 | $63,979 |
| 2014 | $1,677 | $77,917 | $17,260 | $60,657 |
Source: Public Records
Map
Nearby Homes
- 3715 Van Buren Ave
- 1070 40th St
- 1119 37th St
- 964 40th St
- 3828 Quincy Ave
- 904 39th St
- 3813 Grandview Dr
- 3868 Grandview Dr
- 3878 Grandview Dr
- 920 E 4050 S
- 225 E 40th St S
- 1004 36th St
- 4079 S 895 E Unit 67
- 3845 Nordin Ave
- 1066 35th St
- 3476 Brinker Ave
- 3874 Orchard Ave
- 1113 Country Hills Dr Unit G2
- 668 37th St
- 4180 Liberty Ave
- 3836 Eccles Ave
- 3861 Van Buren Ave
- 3853 Van Buren Ave
- 3827 Eccles Ave
- 3845 Van Buren Ave
- 3821 Eccles Ave
- 3835 Van Buren Ave
- 3817 Eccles Ave
- 3804 Eccles Ave
- 3819 Van Buren Ave
- 3811 Eccles Ave
- 3856 Van Buren Ave
- 3803 Van Buren Ave
- 3840 Van Buren Ave
- 3803 Eccles Ave
- 3812 Van Buren Ave
- 3846 Jackson Ave
- 3782 Eccles Ave
- 1121 E 3850 S
- 3787 Van Buren Ave
Your Personal Tour Guide
Ask me questions while you tour the home.