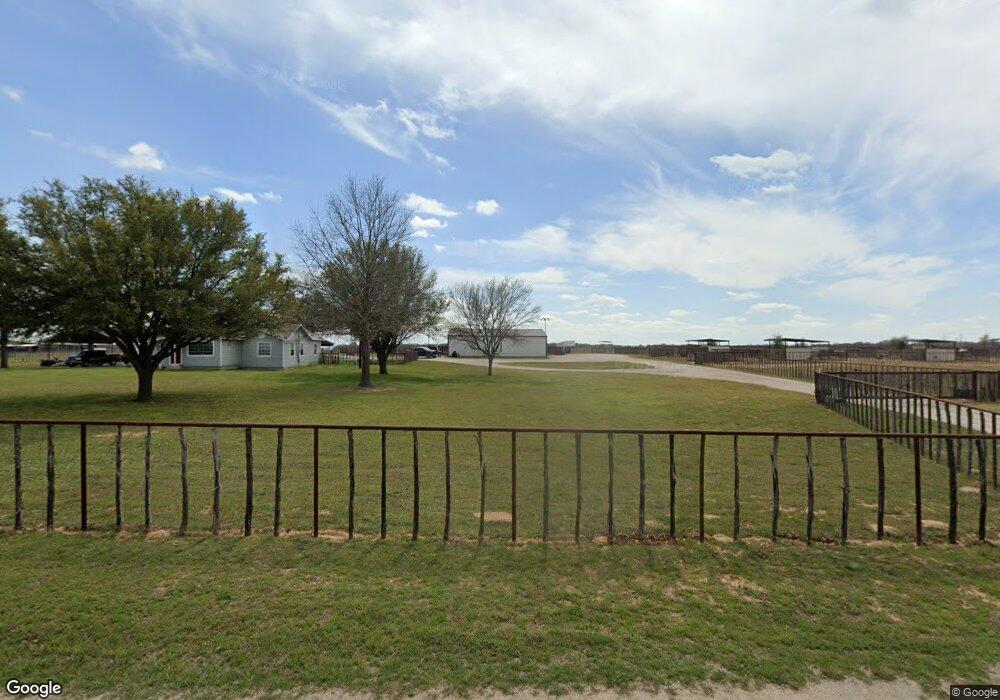
3851 Lazy Bend Rd Millsap, TX 76066
Estimated Value: $667,000
--
Bed
--
Bath
1,722
Sq Ft
$387/Sq Ft
Est. Value
About This Home
This home is located at 3851 Lazy Bend Rd, Millsap, TX 76066 and is currently estimated at $667,000, approximately $387 per square foot. 3851 Lazy Bend Rd is a home located in Parker County with nearby schools including Brock Intermediate School, Brock Junior High School, and Brock High School.
Ownership History
Date
Name
Owned For
Owner Type
Purchase Details
Closed on
Dec 28, 2012
Sold by
Lawley Larry and Lawley Jennifer
Bought by
Busby Jeff
Current Estimated Value
Purchase Details
Closed on
Oct 11, 2001
Sold by
Coalson Mcallen F and Coalson Greg
Bought by
Busby Jeff
Purchase Details
Closed on
May 31, 2000
Sold by
Lab Land & Cattle Inc
Bought by
Busby Jeff
Purchase Details
Closed on
Jan 1, 1901
Bought by
Busby Jeff
Create a Home Valuation Report for This Property
The Home Valuation Report is an in-depth analysis detailing your home's value as well as a comparison with similar homes in the area
Home Values in the Area
Average Home Value in this Area
Purchase History
| Date | Buyer | Sale Price | Title Company |
|---|---|---|---|
| Busby Jeff | -- | -- | |
| Busby Jeff | -- | -- | |
| Busby Jeff | -- | -- | |
| Busby Jeff | -- | -- |
Source: Public Records
Tax History Compared to Growth
Tax History
| Year | Tax Paid | Tax Assessment Tax Assessment Total Assessment is a certain percentage of the fair market value that is determined by local assessors to be the total taxable value of land and additions on the property. | Land | Improvement |
|---|---|---|---|---|
| 2025 | $3,729 | $107,240 | $22,500 | $84,740 |
| 2024 | $3,729 | $201,540 | $22,500 | $179,040 |
| 2023 | $3,729 | $201,540 | $22,500 | $179,040 |
| 2022 | $1,986 | $97,810 | $12,000 | $85,810 |
| 2021 | $2,088 | $97,810 | $12,000 | $85,810 |
| 2020 | $1,921 | $88,770 | $10,000 | $78,770 |
| 2019 | $2,069 | $88,770 | $10,000 | $78,770 |
| 2018 | $2,338 | $99,870 | $7,000 | $92,870 |
| 2017 | $2,298 | $99,870 | $7,000 | $92,870 |
| 2016 | $1,709 | $74,300 | $8,260 | $66,040 |
| 2015 | $1,687 | $74,300 | $8,260 | $66,040 |
| 2014 | $1,496 | $65,210 | $5,000 | $60,210 |
Source: Public Records
Map
Nearby Homes
- 4475 Lazy Bend Rd
- 5845-1 Lazy Bend Rd
- TBD Dude Ln
- TBD B Consolation Dr
- TBD A Consolation Dr
- 0 Dude Ln Unit 20350570
- 2505 Lazy Bend Rd
- 3 W Bluff Ln
- 229 W Bluff Ln
- 114 Esther Ct
- 205 Jimmy Ln
- 209 Jimmy Ln
- 221 Jimmy Ln
- 217 Jimmy Ln
- 213 Jimmy Ln
- 115 Esther Ct
- 225 Jimmy Ln
- 5845 Lazy Bend Rd
- 243 Dixie Rd
- 328 Rita Ridge Ct
- 3972 Lazy Bend Rd
- 3860 Lazy Bend Rd
- 4000 Lazy Bend Rd
- 3655 Lazy Bend Rd
- 4033 Lazy Bend Rd
- 4251 Lazy Bend Rd
- TBD Lazy Bend
- 4280 Lazy Bend Rd
- XXX Lazy Bend Rd
- 3500 Lazy Bend Rd
- 4501 Lazy Bend Rd
- 000A1 Lazy Bend Rd
- 4469 Lazy Bend Rd
- 4451 Lazy Bend Rd
- 350 Dude Ln
- 1100 Dude Ln
- 355 Dude Ln
- 2155 Consolation Dr
- 2101 Consolation Dr
- 2051 Consolation Dr