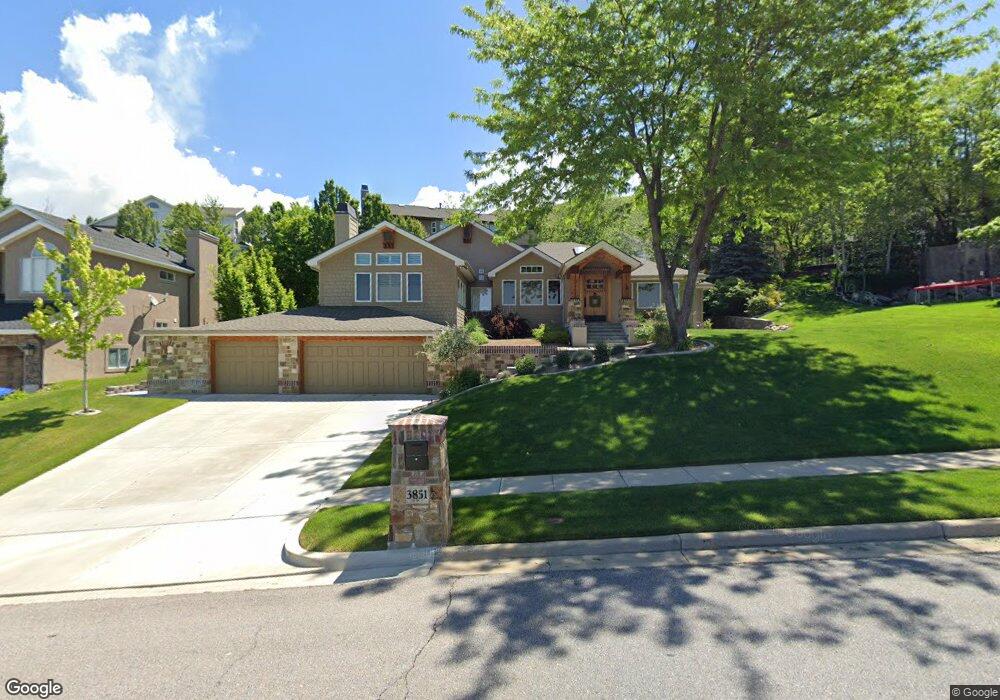
3851 S 400 E Bountiful, UT 84010
Estimated Value: $751,000 - $835,000
5
Beds
3
Baths
2,246
Sq Ft
$353/Sq Ft
Est. Value
About This Home
This home is located at 3851 S 400 E, Bountiful, UT 84010 and is currently estimated at $793,481, approximately $353 per square foot. 3851 S 400 E is a home located in Davis County with nearby schools including Boulton School, Mueller Park Junior High School, and Woods Cross High School.
Ownership History
Date
Name
Owned For
Owner Type
Purchase Details
Closed on
Nov 14, 2016
Sold by
Costanzo David P
Bought by
Dmdc Llc
Current Estimated Value
Purchase Details
Closed on
Nov 7, 2016
Sold by
Dmdc Llc
Bought by
Costanzo David P
Purchase Details
Closed on
Dec 1, 2009
Sold by
Dmdc Llc
Bought by
Dmdc Llc
Purchase Details
Closed on
Nov 5, 2009
Sold by
Costanzo David P
Bought by
Dmdc Llc
Purchase Details
Closed on
Oct 23, 2006
Sold by
Dmdc Llc
Bought by
Costanzo David P
Home Financials for this Owner
Home Financials are based on the most recent Mortgage that was taken out on this home.
Original Mortgage
$248,256
Interest Rate
6.39%
Mortgage Type
Credit Line Revolving
Purchase Details
Closed on
Sep 21, 2001
Sold by
Costanzo David P
Bought by
Dmdc Llc
Purchase Details
Closed on
Nov 12, 1997
Sold by
Roller Shauna V and Costanzo Shauna V
Bought by
Costanzo David P
Create a Home Valuation Report for This Property
The Home Valuation Report is an in-depth analysis detailing your home's value as well as a comparison with similar homes in the area
Purchase History
| Date | Buyer | Sale Price | Title Company |
|---|---|---|---|
| Dmdc Llc | -- | Mountain View Title | |
| Costanzo David P | -- | Mountain View Title | |
| Dmdc Llc | -- | Integrated Title Insura | |
| Dmdc Llc | -- | None Available | |
| Costanzo David P | -- | Mountain View Title & Escrow | |
| Dmdc Llc | -- | -- | |
| Costanzo David P | -- | Merrill Title Company |
Source: Public Records
Mortgage History
| Date | Status | Borrower | Loan Amount |
|---|---|---|---|
| Previous Owner | Costanzo David P | $248,256 |
Source: Public Records
Tax History
| Year | Tax Paid | Tax Assessment Tax Assessment Total Assessment is a certain percentage of the fair market value that is determined by local assessors to be the total taxable value of land and additions on the property. | Land | Improvement |
|---|---|---|---|---|
| 2025 | $4,358 | $433,950 | $143,796 | $290,154 |
| 2024 | $4,093 | $414,149 | $132,421 | $281,728 |
| 2023 | $4,015 | $404,250 | $133,201 | $271,048 |
| 2022 | $4,086 | $745,000 | $235,004 | $509,996 |
| 2021 | $3,760 | $578,000 | $192,284 | $385,716 |
| 2020 | $3,299 | $513,000 | $175,039 | $337,961 |
| 2019 | $3,470 | $527,000 | $143,570 | $383,430 |
| 2018 | $3,302 | $496,000 | $140,536 | $355,464 |
| 2016 | $2,877 | $234,465 | $48,651 | $185,814 |
| 2015 | $3,004 | $231,440 | $48,651 | $182,789 |
| 2014 | $2,982 | $235,033 | $48,651 | $186,382 |
| 2013 | -- | $181,917 | $71,552 | $110,365 |
Source: Public Records
Map
Nearby Homes
- 3893 S Bountiful Blvd
- 3759 S Huntington Dr
- 407 Hidden Lake Dr
- 348 Hidden Lake Dr
- 348 Hidden Lake Dr Unit 107
- 3716 S Oakridge Cir
- 8 E 3500 S
- 424 E Canyon Estates Dr S
- 136 E Fairway Dr
- 438 Indian Springs Rd
- 3285 S Davis Blvd
- 4031 Mountain Oaks Dr Unit 308
- 53 N Foxhill Rd
- 294 Springridge Dr
- 3252 Sunset Hollow Dr
- 336 W 3500 S
- 90 Scenic Hills Cir
- 468 W 3200 S
- 337 W 2900 S
- 41 Acorn Dr
- 3879 Bountiful Blvd
- 3873 S 400 E
- 3829 S 400 E
- 3834 Huntington Dr
- 3878 Bountiful Blvd
- 3864 S Bountiful Blvd
- 3818 Huntington Dr
- 3864 Bountiful Blvd
- 3865 Bountiful Blvd
- 3818 Huntington Dr
- 3809 S 400 E
- 3894 Bountiful Blvd
- 3634 S Bountiful Blvd Unit 23
- 1785 S Bountiful Blvd Unit 101
- 3798 Huntington Dr
- 3837 Huntington Dr
- 3837 Huntington Dr
- 3817 Huntington Dr
- 3795 S 400 E
- 3893 Bountiful Blvd
Your Personal Tour Guide
Ask me questions while you tour the home.