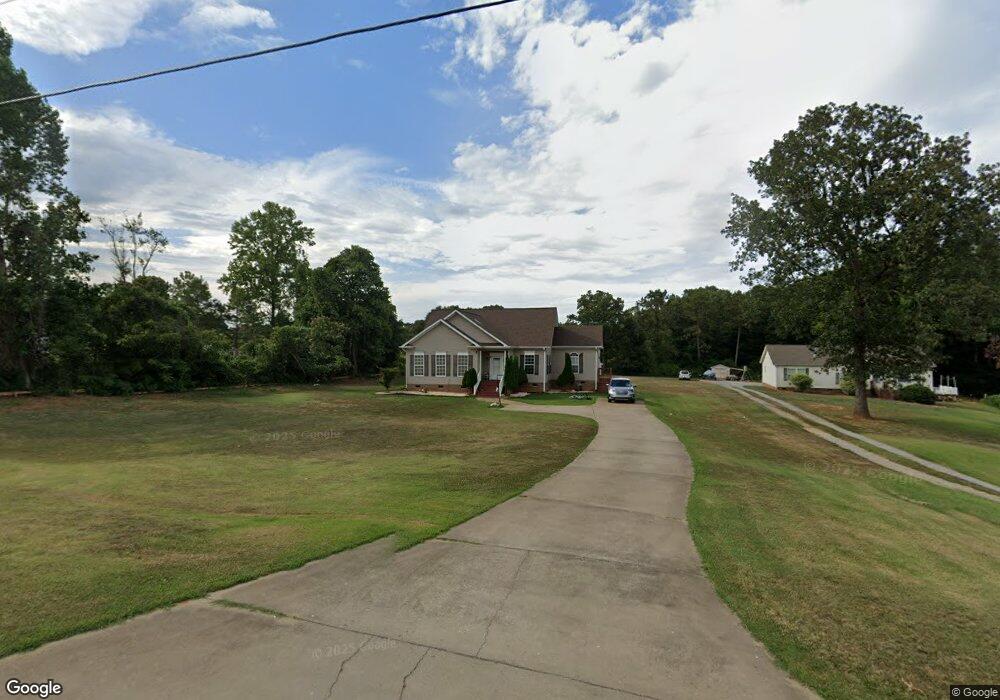
3852 Towery Rd Shelby, NC 28150
Estimated Value: $317,000 - $430,000
Studio
--
Bath
1,687
Sq Ft
$209/Sq Ft
Est. Value
About This Home
This home is located at 3852 Towery Rd, Shelby, NC 28150 and is currently estimated at $352,758, approximately $209 per square foot. 3852 Towery Rd is a home located in Cleveland County with nearby schools including Springmore Elementary School, Crest Middle School, and Crest High School.
Ownership History
Date
Name
Owned For
Owner Type
Purchase Details
Closed on
Mar 31, 2014
Sold by
Jones Chad Christopher and Jones Rebekah W
Bought by
Patel Mileshkumar R
Current Estimated Value
Home Financials for this Owner
Home Financials are based on the most recent Mortgage that was taken out on this home.
Original Mortgage
$127,500
Outstanding Balance
$96,778
Interest Rate
4.3%
Mortgage Type
New Conventional
Estimated Equity
$255,980
Create a Home Valuation Report for This Property
The Home Valuation Report is an in-depth analysis detailing your home's value as well as a comparison with similar homes in the area
Home Values in the Area
Average Home Value in this Area
Purchase History
| Date | Buyer | Sale Price | Title Company |
|---|---|---|---|
| Patel Mileshkumar R | $169,000 | None Available |
Source: Public Records
Mortgage History
| Date | Status | Borrower | Loan Amount |
|---|---|---|---|
| Open | Patel Mileshkumar R | $127,500 |
Source: Public Records
Tax History
| Year | Tax Paid | Tax Assessment Tax Assessment Total Assessment is a certain percentage of the fair market value that is determined by local assessors to be the total taxable value of land and additions on the property. | Land | Improvement |
|---|---|---|---|---|
| 2025 | $1,958 | $308,403 | $17,877 | $290,526 |
| 2024 | $1,998 | $241,240 | $14,898 | $226,342 |
| 2023 | $1,996 | $241,240 | $14,898 | $226,342 |
| 2022 | $1,988 | $241,240 | $14,898 | $226,342 |
| 2021 | $1,996 | $241,240 | $14,898 | $226,342 |
| 2020 | $1,387 | $158,724 | $14,898 | $143,826 |
| 2019 | $1,387 | $158,724 | $14,898 | $143,826 |
| 2018 | $1,383 | $158,724 | $14,898 | $143,826 |
| 2017 | $1,376 | $158,724 | $14,898 | $143,826 |
| 2016 | $1,316 | $158,724 | $14,898 | $143,826 |
| 2015 | $1,293 | $155,817 | $14,898 | $140,919 |
| 2014 | $1,293 | $155,817 | $14,898 | $140,919 |
Source: Public Records
Map
Nearby Homes
- 128 Westlee St Unit B
- 128 Westlee St Unit LotWP004
- 128 Westlee St
- 128 Westlee St Unit LotWP001
- 128 Westlee St Unit LotWP005
- 128 Westlee St Unit C
- 00 Lattimore Rd
- 3839 W Dixon Blvd
- 248 Pinnacle Crossing
- 110 Oak Crossing Dr
- 120 Bradley Rd
- 701 Cherry Ln
- 116 & 118 Webb Rd
- 109 Coopers Corner
- 2333 Washburn Rd
- 211 Webb Farm Rd
- 6102 Len Dr
- 219 Plato Lee Rd
- 336 Webb Farm Rd
- 00 McBrayer Homestead Rd
Your Personal Tour Guide
Ask me questions while you tour the home.