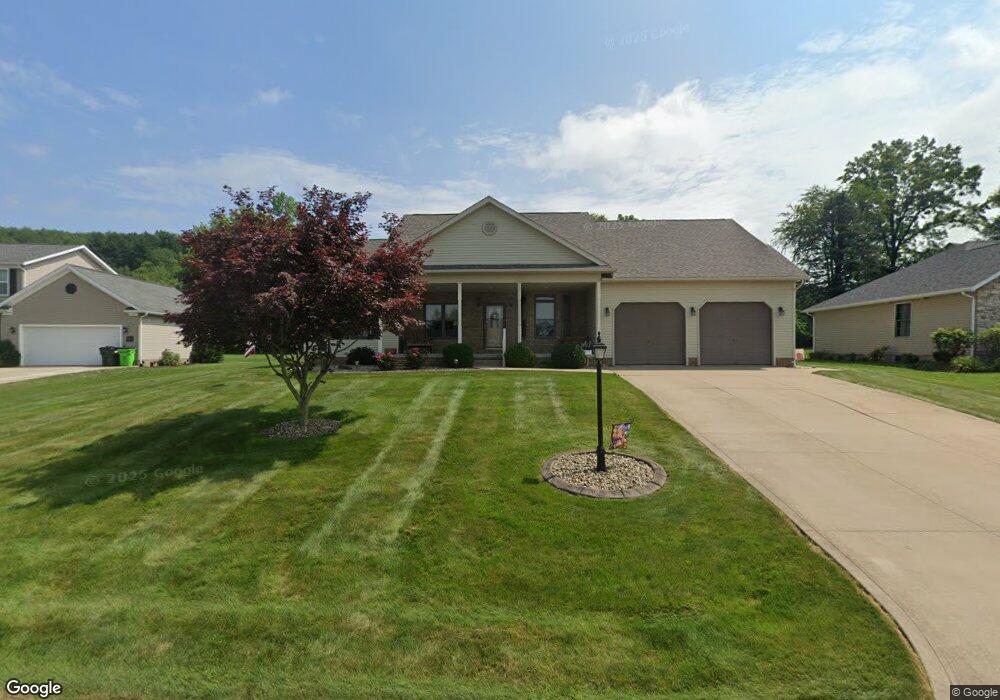
3853 Clay Ct SE Dennison, OH 44621
Estimated Value: $265,000 - $361,000
3
Beds
3
Baths
1,897
Sq Ft
$169/Sq Ft
Est. Value
About This Home
This home is located at 3853 Clay Ct SE, Dennison, OH 44621 and is currently estimated at $320,442, approximately $168 per square foot. 3853 Clay Ct SE is a home located in Tuscarawas County with nearby schools including Claymont High School and Immaculate Conception School.
Ownership History
Date
Name
Owned For
Owner Type
Purchase Details
Closed on
Jul 25, 2013
Sold by
Lentz Richard L and Lentz Sara E
Bought by
Lentz Barry J and Stull Kim R
Current Estimated Value
Purchase Details
Closed on
Mar 28, 2013
Sold by
Lentz Barry J and Stull Kim R
Bought by
Lentz Richard L and Lentz Sara E
Purchase Details
Closed on
Nov 27, 2012
Sold by
Lentz Richard L and Lentz Sara E
Bought by
Lentz Barry J and Stull Kim R
Purchase Details
Closed on
May 27, 2005
Sold by
Jenifer Ltd
Bought by
Lentz Richard L and Lentz Sara E
Create a Home Valuation Report for This Property
The Home Valuation Report is an in-depth analysis detailing your home's value as well as a comparison with similar homes in the area
Home Values in the Area
Average Home Value in this Area
Purchase History
| Date | Buyer | Sale Price | Title Company |
|---|---|---|---|
| Lentz Barry J | -- | None Available | |
| Lentz Richard L | -- | None Available | |
| Lentz Barry J | -- | None Available | |
| Lentz Richard L | $68,000 | Tusc Title |
Source: Public Records
Tax History Compared to Growth
Tax History
| Year | Tax Paid | Tax Assessment Tax Assessment Total Assessment is a certain percentage of the fair market value that is determined by local assessors to be the total taxable value of land and additions on the property. | Land | Improvement |
|---|---|---|---|---|
| 2024 | $2,247 | $80,580 | $10,920 | $69,660 |
| 2023 | $2,247 | $230,250 | $31,210 | $199,040 |
| 2022 | $2,349 | $80,588 | $10,924 | $69,664 |
| 2021 | $2,161 | $69,549 | $12,051 | $57,498 |
| 2020 | $2,209 | $69,549 | $12,051 | $57,498 |
| 2019 | $2,041 | $69,549 | $12,051 | $57,498 |
| 2018 | $1,853 | $61,990 | $10,740 | $51,250 |
| 2017 | $1,855 | $61,990 | $10,740 | $51,250 |
| 2016 | $1,841 | $61,990 | $10,740 | $51,250 |
| 2014 | $1,686 | $56,760 | $10,380 | $46,380 |
| 2013 | $1,691 | $56,760 | $10,380 | $46,380 |
Source: Public Records
Map
Nearby Homes
- 3264 Simpson Rd SE
- 2025 N Water Street Extension
- 4161 Indian Hill Rd SE
- 1508 Roanoke Ave
- 1870 Midvale Mine Rd SE
- 0 Vernon St Unit 5009296
- 1221 Eastport Ave
- 0 Royal St
- 2993 Brightwood Rd SE
- 4711 Broadway
- 934 Parrish St
- 834 N Water St
- 2923 Brightwood Rd SE
- 717 N 4th St
- 523 N 1st St
- 123 E 7th St
- 620 Gorley St
- 518 N Uhrich St
- 318 N 5th St
- 113 E 4th St