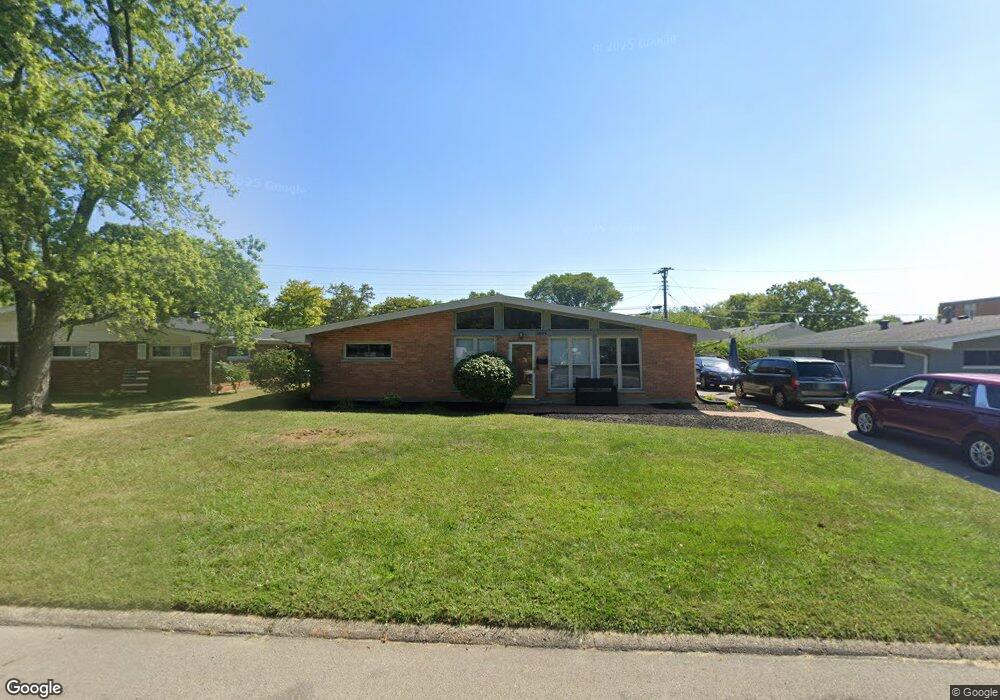
3854 Ackerman Blvd Dayton, OH 45429
Estimated Value: $220,531 - $235,000
4
Beds
2
Baths
1,318
Sq Ft
$175/Sq Ft
Est. Value
About This Home
This home is located at 3854 Ackerman Blvd, Dayton, OH 45429 and is currently estimated at $230,383, approximately $174 per square foot. 3854 Ackerman Blvd is a home located in Montgomery County with nearby schools including Oakview Elementary School, Van Buren Middle School, and Kettering Fairmont High School.
Ownership History
Date
Name
Owned For
Owner Type
Purchase Details
Closed on
Nov 12, 2019
Sold by
Luci Amber M and Luci Vincent
Bought by
Wolford Jeffrey A and Waugh Katherine
Current Estimated Value
Home Financials for this Owner
Home Financials are based on the most recent Mortgage that was taken out on this home.
Original Mortgage
$142,907
Outstanding Balance
$125,304
Interest Rate
3.65%
Mortgage Type
VA
Estimated Equity
$105,079
Purchase Details
Closed on
Dec 8, 2016
Sold by
Steininger Herbert W and Steininger Catherine C
Bought by
Mathews Amber M
Home Financials for this Owner
Home Financials are based on the most recent Mortgage that was taken out on this home.
Original Mortgage
$117,472
Interest Rate
3.47%
Mortgage Type
VA
Purchase Details
Closed on
Mar 11, 1996
Sold by
Reed Todd W and Reed Khristie
Bought by
Steininger Herbert W and Steininger Catherine C
Create a Home Valuation Report for This Property
The Home Valuation Report is an in-depth analysis detailing your home's value as well as a comparison with similar homes in the area
Home Values in the Area
Average Home Value in this Area
Purchase History
| Date | Buyer | Sale Price | Title Company |
|---|---|---|---|
| Wolford Jeffrey A | $139,900 | Home Services Title Llc | |
| Mathews Amber M | $115,000 | Home Services Title Llc | |
| Steininger Herbert W | -- | -- |
Source: Public Records
Mortgage History
| Date | Status | Borrower | Loan Amount |
|---|---|---|---|
| Open | Wolford Jeffrey A | $142,907 | |
| Previous Owner | Mathews Amber M | $117,472 |
Source: Public Records
Tax History
| Year | Tax Paid | Tax Assessment Tax Assessment Total Assessment is a certain percentage of the fair market value that is determined by local assessors to be the total taxable value of land and additions on the property. | Land | Improvement |
|---|---|---|---|---|
| 2025 | $3,694 | $57,340 | $14,180 | $43,160 |
| 2024 | $3,589 | $57,340 | $14,180 | $43,160 |
| 2023 | $3,589 | $57,340 | $14,180 | $43,160 |
| 2022 | $3,298 | $41,600 | $10,270 | $31,330 |
| 2021 | $3,053 | $41,600 | $10,270 | $31,330 |
| 2020 | $3,062 | $41,600 | $10,270 | $31,330 |
| 2019 | $3,323 | $38,870 | $10,270 | $28,600 |
| 2018 | $3,250 | $38,870 | $10,270 | $28,600 |
| 2017 | $2,995 | $38,870 | $10,270 | $28,600 |
| 2016 | $2,121 | $34,420 | $10,270 | $24,150 |
| 2015 | $2,028 | $34,420 | $10,270 | $24,150 |
| 2014 | $2,028 | $34,420 | $10,270 | $24,150 |
| 2012 | -- | $36,730 | $10,280 | $26,450 |
Source: Public Records
Map
Nearby Homes
- 4008 Ackerman Blvd
- 3826 California Ave
- 3737 Saranac Dr
- 3716 Wenzler Dr
- 1105 Chateau Dr
- 516 Oakview Dr
- 1108 Chateau Dr
- 500 Schuyler Dr
- 889 Timberlake Ct
- 876 Timberlake Ct
- 791 Ashton Cir Unit 103
- 1905 Tait Rd
- 825 Lincoln Woods Ct
- 4432 Renwood Dr
- 889 Lincoln Woods Ct
- 326 N Bromfield Rd
- 1138 Sharon Ave
- 3723 Roslyn Ave
- 4244 Flowerdale Ave
- 587 Cottingwood Ct
- 3848 Ackerman Blvd
- 3860 Ackerman Blvd
- 3857 Longridge Dr
- 3851 Longridge Dr
- 911 Kenosha Rd
- 3842 Ackerman Blvd
- 3845 Longridge Dr
- 3853 Ackerman Blvd
- 3847 Ackerman Blvd
- 3836 Ackerman Blvd
- 833 Kenosha Rd
- 3839 Longridge Dr
- 3841 Ackerman Blvd
- 3856 Longridge Dr
- 3850 Longridge Dr
- 925 Kenosha Rd
- 3830 Ackerman Blvd
- 3844 Longridge Dr
- 3901 Ackerman Blvd
- 3835 Ackerman Blvd
Your Personal Tour Guide
Ask me questions while you tour the home.