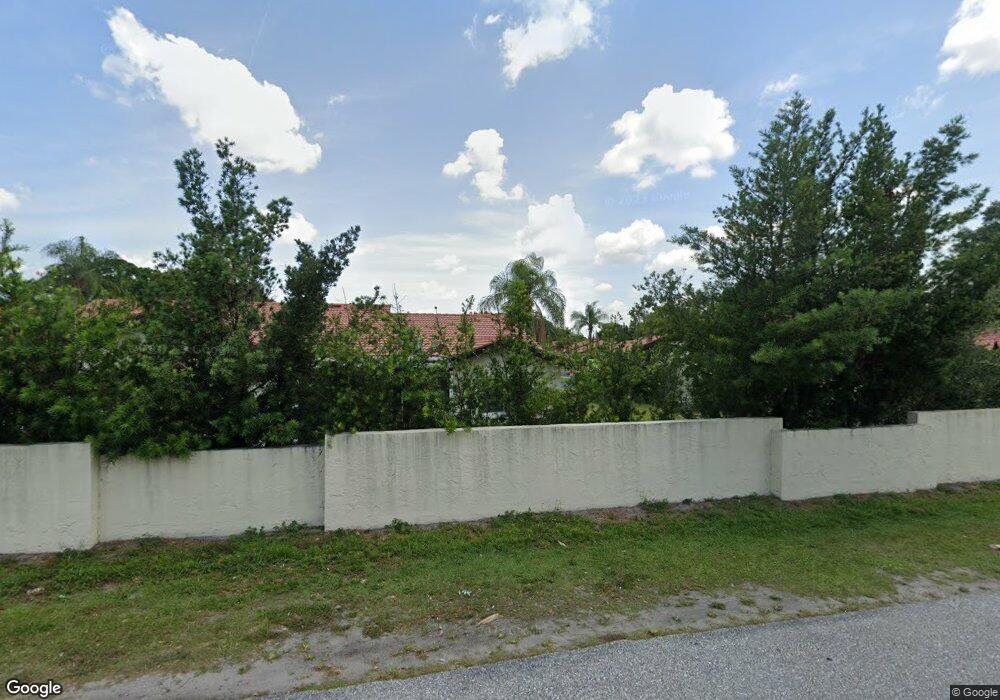
3856 El Poinier Ct Unit 8705 Sarasota, FL 34232
Estimated Value: $250,355 - $406,000
2
Beds
2
Baths
1,498
Sq Ft
$215/Sq Ft
Est. Value
About This Home
This home is located at 3856 El Poinier Ct Unit 8705, Sarasota, FL 34232 and is currently estimated at $322,089, approximately $215 per square foot. 3856 El Poinier Ct Unit 8705 is a home located in Sarasota County with nearby schools including Wilkinson Elementary School, Brookside Middle School, and Sarasota High School.
Ownership History
Date
Name
Owned For
Owner Type
Purchase Details
Closed on
Sep 10, 2021
Sold by
Neitzel Richard A
Bought by
Mcveigh James and Mcveigh Jennifer
Current Estimated Value
Home Financials for this Owner
Home Financials are based on the most recent Mortgage that was taken out on this home.
Original Mortgage
$188,000
Outstanding Balance
$171,066
Interest Rate
2.8%
Mortgage Type
New Conventional
Estimated Equity
$151,023
Purchase Details
Closed on
May 18, 2021
Sold by
Philip G Neitzel Revocable Trust and Neitzel Stephen P
Bought by
Neitzel Richard A
Purchase Details
Closed on
Sep 3, 2009
Sold by
Neitzel Philip G
Bought by
Neitzel Philip G and Philip G Neitzel Revocable Trust
Purchase Details
Closed on
Dec 1, 1997
Sold by
Egyed Louis and Egyed Irene
Bought by
Neitzel Philip G and Neitzel Sandra A
Purchase Details
Closed on
Sep 26, 1997
Sold by
Donovan Lisa A
Bought by
Egyed Louis and Egyed Irene
Create a Home Valuation Report for This Property
The Home Valuation Report is an in-depth analysis detailing your home's value as well as a comparison with similar homes in the area
Home Values in the Area
Average Home Value in this Area
Purchase History
| Date | Buyer | Sale Price | Title Company |
|---|---|---|---|
| Mcveigh James | $235,000 | None Listed On Document | |
| Neitzel Richard A | $100 | None Listed On Document | |
| Neitzel Philip G | -- | Attorney | |
| Neitzel Philip G | $90,500 | -- | |
| Egyed Louis | $82,000 | -- |
Source: Public Records
Mortgage History
| Date | Status | Borrower | Loan Amount |
|---|---|---|---|
| Open | Mcveigh James | $188,000 |
Source: Public Records
Tax History Compared to Growth
Tax History
| Year | Tax Paid | Tax Assessment Tax Assessment Total Assessment is a certain percentage of the fair market value that is determined by local assessors to be the total taxable value of land and additions on the property. | Land | Improvement |
|---|---|---|---|---|
| 2024 | $3,551 | $241,000 | -- | $241,000 |
| 2023 | $3,551 | $256,400 | $0 | $256,400 |
| 2022 | $3,192 | $220,400 | $0 | $220,400 |
| 2021 | $2,486 | $156,200 | $0 | $156,200 |
| 2020 | $1,281 | $93,936 | $0 | $0 |
| 2019 | $1,220 | $91,824 | $0 | $0 |
| 2018 | $1,176 | $90,112 | $0 | $0 |
| 2017 | $1,167 | $88,259 | $0 | $0 |
| 2016 | $1,044 | $128,500 | $0 | $128,500 |
| 2015 | $1,057 | $106,100 | $0 | $106,100 |
| 2014 | $1,051 | $83,903 | $0 | $0 |
Source: Public Records
Map
Nearby Homes
- 3873 El Poinier Ct Unit 8725
- 3880 El Poinier Ct Unit 8702
- 3807 El Poinier Ct Unit 8714
- 3525 Riviera Dr
- 3540 Hispania Place Unit 214
- 3690 Pinecrest St Unit 114
- 3690 Pinecrest St Unit 124
- 3267 Beneva Rd Unit 103
- 3283 Beneva Rd Unit 101
- 3269 Beneva Rd Unit 103
- 3269 Beneva Rd Unit 203
- 3227 Beneva Rd Unit 203
- 3281 Beneva Rd Unit 202
- 3265 Beneva Rd Unit 202
- 3271 Beneva Rd Unit 204
- 3409 Montilla Ct Unit 8410
- 3504 Beneva Rd Unit 206
- 3425 W Forest Lake Cir
- 3983 MacEachen Blvd Unit 432
- 3987 MacEachen Blvd Unit 123
- 3800 El Poinier Ct Unit 8712
- 3831 El Poinier Ct Unit 8718
- 3819 El Poinier Ct Unit 8716
- 3849 El Poinier Ct Unit 8721
- 3872 El Poinier Ct Unit 8703
- 3891 El Poinier Ct Unit 8728
- 3855 El Poinier Ct Unit 8722
- 3837 El Poinier Ct Unit 8719
- 3873 El Poinier Ct
- 3825 El Poinier Ct Unit 8717
- 3824 El Poinier Ct Unit 8709
- 3840 El Poinier Ct Unit 8707
- 3808 El Poinier Ct Unit 8711
- 3813 El Poinier Ct Unit 8715
- 3801 El Poinier Ct Unit 8713
- 3808 El Poinier Ct
- 3867 El Poinier Ct Unit 8724
- 3813 El Poinier Ct
- 3861 El Poinier Ct Unit 8723
- 3848 El Poinier Ct