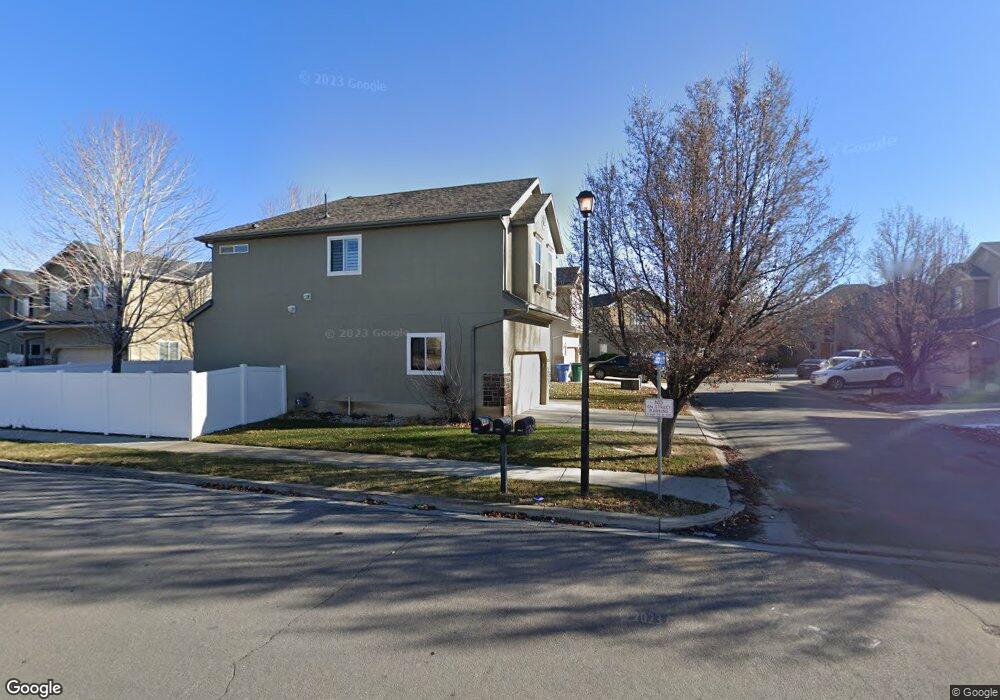
3856 Newland Loop Unit 5 Lehi, UT 84043
Thanksgiving NeighborhoodEstimated Value: $537,049 - $557,000
5
Beds
3
Baths
2,249
Sq Ft
$243/Sq Ft
Est. Value
About This Home
This home is located at 3856 Newland Loop Unit 5, Lehi, UT 84043 and is currently estimated at $546,512, approximately $243 per square foot. 3856 Newland Loop Unit 5 is a home located in Utah County with nearby schools including Belmont Elementary, Skyridge High School, and Ignite Entrepreneurship Academy.
Ownership History
Date
Name
Owned For
Owner Type
Purchase Details
Closed on
Jun 22, 2017
Sold by
Dominguez Christopher and Dominguez Charla
Bought by
Marler David J
Current Estimated Value
Home Financials for this Owner
Home Financials are based on the most recent Mortgage that was taken out on this home.
Original Mortgage
$313,600
Outstanding Balance
$261,064
Interest Rate
4.05%
Estimated Equity
$285,448
Purchase Details
Closed on
Sep 25, 2015
Sold by
Schaelling Colleen S and Schaelling John P
Bought by
Schaelling John P and Schaelling Colleen S
Purchase Details
Closed on
Mar 1, 2012
Sold by
Suamataia Leroy Fl and Suamataia Tamara Mma
Bought by
Schaelling Colleen S and Schaelling John P
Home Financials for this Owner
Home Financials are based on the most recent Mortgage that was taken out on this home.
Original Mortgage
$124,350
Interest Rate
3.83%
Purchase Details
Closed on
Jul 25, 2007
Sold by
Gali Setema V
Bought by
Suamataia Leroy F L and Suamataia Tamara M M A
Home Financials for this Owner
Home Financials are based on the most recent Mortgage that was taken out on this home.
Original Mortgage
$225,250
Interest Rate
9.99%
Purchase Details
Closed on
Oct 10, 2003
Sold by
Sundance Homes Llc
Bought by
Thayn Joshua K and Thayn Marisa L
Home Financials for this Owner
Home Financials are based on the most recent Mortgage that was taken out on this home.
Original Mortgage
$138,400
Interest Rate
6.27%
Create a Home Valuation Report for This Property
The Home Valuation Report is an in-depth analysis detailing your home's value as well as a comparison with similar homes in the area
Home Values in the Area
Average Home Value in this Area
Purchase History
| Date | Buyer | Sale Price | Title Company |
|---|---|---|---|
| Marler David J | -- | Liberty Title Co Llc | |
| Schaelling John P | -- | Old Republic Title | |
| Dominguez Christopher | -- | Old Republic Title | |
| Schaelling Colleen S | -- | None Available | |
| Suamataia Leroy F L | -- | Inwest Title Services Inc | |
| Thayn Joshua K | -- | Signature Title |
Source: Public Records
Mortgage History
| Date | Status | Borrower | Loan Amount |
|---|---|---|---|
| Open | Marler David J | $313,600 | |
| Previous Owner | Schaelling Colleen S | $124,350 | |
| Previous Owner | Suamataia Leroy F L | $225,250 | |
| Previous Owner | Thayn Joshua K | $138,400 |
Source: Public Records
Tax History Compared to Growth
Tax History
| Year | Tax Paid | Tax Assessment Tax Assessment Total Assessment is a certain percentage of the fair market value that is determined by local assessors to be the total taxable value of land and additions on the property. | Land | Improvement |
|---|---|---|---|---|
| 2025 | $2,178 | $269,280 | $193,800 | $295,800 |
| 2024 | $2,178 | $254,870 | $0 | $0 |
| 2023 | $2,047 | $260,095 | $0 | $0 |
| 2022 | $2,218 | $273,240 | $0 | $0 |
| 2021 | $1,991 | $370,800 | $112,100 | $258,700 |
| 2020 | $1,877 | $345,600 | $103,800 | $241,800 |
| 2019 | $1,670 | $319,600 | $103,800 | $215,800 |
| 2018 | $1,564 | $283,000 | $94,600 | $188,400 |
| 2017 | $1,506 | $144,870 | $0 | $0 |
| 2016 | $1,382 | $123,310 | $0 | $0 |
| 2015 | -- | $107,470 | $0 | $0 |
| 2014 | $1,242 | $104,555 | $0 | $0 |
Source: Public Records
Map
Nearby Homes
- 3931 N Davencourt Loop
- 4328 W Harvest Cove Unit 5
- 3162 W Desert Lily Dr
- 3147 W Davencourt Loop
- 4176 N Pilgrims Cir
- 3741 N Meadow Springs Ln
- 68-185 E Talisman Ave
- 3477 N Bear Hollow Way
- 4063 New Land Loop
- 4253 N Buckstone Way Unit 1368
- 4257 N Buckstone Way Unit 1369
- 4261 N Buckstone Way Unit 1370
- 4265 N Buckstone Way Unit 1371
- 4269 N Buckstone Way Unit 1372
- 4273 N Buckstone Way Unit 1373
- 340-1082 E Glencoe Dr
- 269 E Levengrove Dr Unit 182
- 328-1080 E Glencoe Dr
- 269 E Levengrove Dr
- 334-1081 E Glencoe Dr
- 3856 Newland Loop
- 3856 Newland Loop
- 3856 Newland Loop Unit 1
- 3856 Newland Loop Unit 3
- 3856 N Newland Loop
- 3856 N Newland Loop Unit 2
- 3856 N Newland Loop Unit 3
- 3856 N Newland Loop Unit 4
- 3856 N Newland Loop
- 3856 N Newland Loop Unit 5
- 3856 N Newland Loop Unit 1
- 3866 Newland Loop
- 3866 Newland Loop
- 3866 Newland Loop
- 3866 N Newland Loop W Unit 1
- 3878 Newland Loop
- 3878 N Newland Loop
- 3898 Newland Loop
- 3898 N Newland Loop
- 3852 N Newland Loop Unit 5