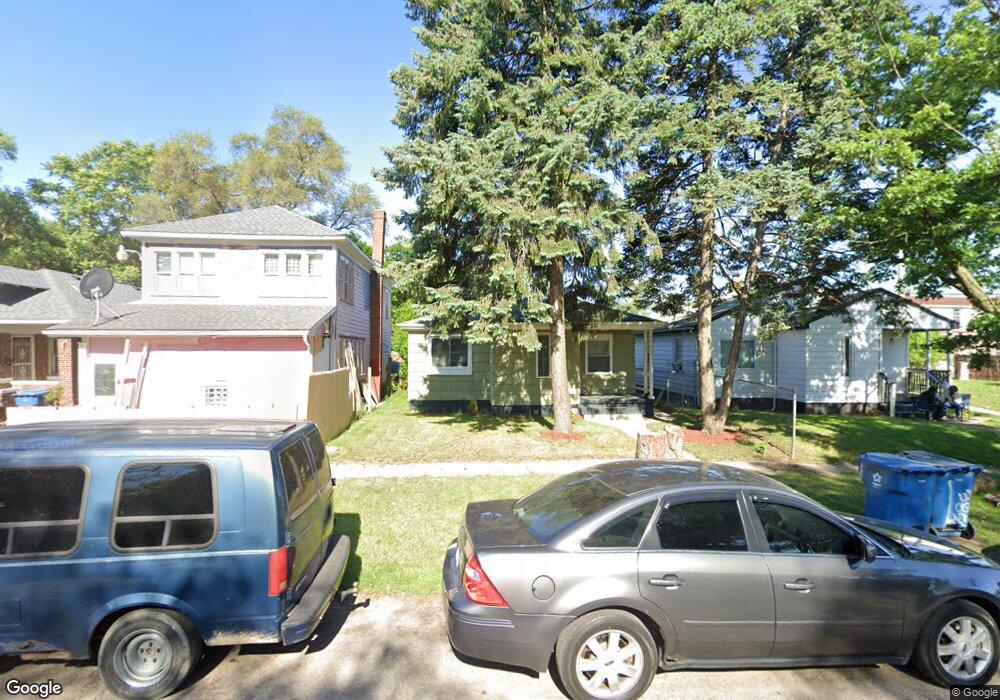
3856 Van Buren St Gary, IN 46408
Glen Park NeighborhoodEstimated Value: $81,673 - $145,000
3
Beds
1
Bath
1,062
Sq Ft
$110/Sq Ft
Est. Value
About This Home
This home is located at 3856 Van Buren St, Gary, IN 46408 and is currently estimated at $116,918, approximately $110 per square foot. 3856 Van Buren St is a home located in Lake County with nearby schools including Glen Park Academy for Excellence in Learning, Bailly Preparatory Academy, and West Side Leadership Academy.
Ownership History
Date
Name
Owned For
Owner Type
Purchase Details
Closed on
Aug 17, 2021
Sold by
Pearson Craig A and Pearson Robin J
Bought by
Dent Lamont Dwaune
Current Estimated Value
Purchase Details
Closed on
Aug 9, 2021
Sold by
Pearson Robin and Pearson Craig
Bought by
Dent Lamont
Purchase Details
Closed on
Oct 1, 2020
Sold by
Ledge Llc
Bought by
Pearson Craig A and Pearson Robin J
Purchase Details
Closed on
Sep 19, 2018
Sold by
Homesolutions Properties Llc
Bought by
Ledge Llc
Purchase Details
Closed on
Mar 6, 2009
Sold by
Homesolutions Properties Llc
Bought by
Daniels Debra
Home Financials for this Owner
Home Financials are based on the most recent Mortgage that was taken out on this home.
Original Mortgage
$23,000
Interest Rate
4.27%
Mortgage Type
Seller Take Back
Purchase Details
Closed on
Nov 14, 2008
Sold by
Fannie Mae
Bought by
Homesolutions Properties Llc
Purchase Details
Closed on
Jul 11, 2008
Sold by
Leal Maria D
Bought by
Federal National Mortgage Association
Create a Home Valuation Report for This Property
The Home Valuation Report is an in-depth analysis detailing your home's value as well as a comparison with similar homes in the area
Home Values in the Area
Average Home Value in this Area
Purchase History
| Date | Buyer | Sale Price | Title Company |
|---|---|---|---|
| Dent Lamont Dwaune | $4,500 | None Available | |
| Dent Lamont | $4,500 | None Available | |
| Pearson Craig A | -- | None Available | |
| Ledge Llc | -- | None Available | |
| Daniels Debra | $24,500 | None Available | |
| Homesolutions Properties Llc | -- | Title One | |
| Federal National Mortgage Association | $31,639 | None Available |
Source: Public Records
Mortgage History
| Date | Status | Borrower | Loan Amount |
|---|---|---|---|
| Previous Owner | Daniels Debra | $23,000 |
Source: Public Records
Tax History
| Year | Tax Paid | Tax Assessment Tax Assessment Total Assessment is a certain percentage of the fair market value that is determined by local assessors to be the total taxable value of land and additions on the property. | Land | Improvement |
|---|---|---|---|---|
| 2025 | $1,212 | $73,800 | $6,400 | $67,400 |
| 2024 | $3,756 | $41,200 | $6,200 | $35,000 |
| 2023 | $899 | $42,600 | $6,200 | $36,400 |
| 2022 | $899 | $35,100 | $2,300 | $32,800 |
| 2021 | $825 | $32,200 | $2,300 | $29,900 |
| 2020 | $769 | $30,000 | $2,300 | $27,700 |
| 2019 | $789 | $34,200 | $2,600 | $31,600 |
| 2018 | $479 | $36,600 | $2,800 | $33,800 |
| 2017 | $490 | $37,400 | $2,800 | $34,600 |
| 2016 | $504 | $39,000 | $2,800 | $36,200 |
| 2014 | $386 | $39,700 | $3,500 | $36,200 |
| 2013 | $422 | $42,900 | $3,500 | $39,400 |
Source: Public Records
Map
Nearby Homes
- 4151 Harrison St
- 519 W 39th Ave
- 3953 Monroe St
- 3756 Tyler St
- 3752 Tyler St
- 4024 Tyler St Unit 28
- 3980 Madison St
- 3992 Madison St
- 4016 Madison St
- 3701 Monroe St
- 3731 Madison St
- 3634 Van Buren St
- 4034 Fillmore St
- 3940 Pierce St
- 229-231 W 37th Ave
- 1301 W Ridge Rd
- 234 W 41st Ave
- 4169 Monroe St
- 3744 Washington St
- 3679 Buchanan St
- 3860 Van Buren St
- 3848 Van Buren St
- 3864 Van Buren St
- 3870 Van Buren St
- 3874 Van Buren St
- 3855 Harrison St
- 703 W Ridge Rd
- 713 W Ridge Rd
- 3863 Harrison St
- 3880 Van Buren St
- 3871 Harrison St
- 729 W Ridge Rd
- 3879 Harrison St
- 3859 Van Buren St
- 3863 Van Buren St
- 701 W Ridge Rd
- 3849 Van Buren St
- 704 W 39th Ave
- 3885 Harrison St
- 736 W 39th Ave
Your Personal Tour Guide
Ask me questions while you tour the home.