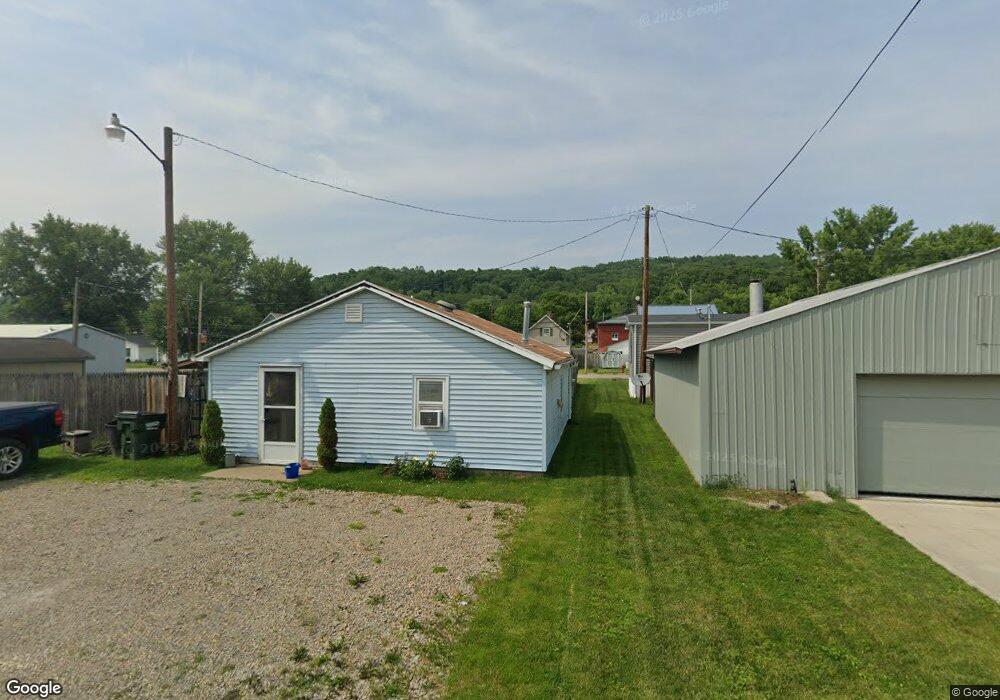
3858 Stevenson Dr Midvale, OH 44653
Estimated Value: $47,000 - $101,000
2
Beds
1
Bath
720
Sq Ft
$107/Sq Ft
Est. Value
About This Home
This home is located at 3858 Stevenson Dr, Midvale, OH 44653 and is currently estimated at $77,155, approximately $107 per square foot. 3858 Stevenson Dr is a home located in Tuscarawas County with nearby schools including Midvale Elementary School, Tuscarawas Middle School, and Indian Valley High School.
Ownership History
Date
Name
Owned For
Owner Type
Purchase Details
Closed on
Aug 18, 2015
Sold by
Bean Michael J
Bought by
Bean David M
Current Estimated Value
Purchase Details
Closed on
Oct 27, 2011
Sold by
Bean Michael J and Bean David M
Bought by
Bean Michael J and Bean David M
Purchase Details
Closed on
Aug 12, 2009
Sold by
J & R Signature Properties Llc
Bought by
Bean Michael J and Bean David M
Purchase Details
Closed on
May 8, 2008
Sold by
J & R Signature Properties Llc
Bought by
Thompson Michael E
Home Financials for this Owner
Home Financials are based on the most recent Mortgage that was taken out on this home.
Original Mortgage
$35,900
Interest Rate
5.87%
Mortgage Type
Seller Take Back
Purchase Details
Closed on
Feb 27, 2008
Sold by
Miller James L and Miller Rachel
Bought by
J & R Signature Properties Llc
Purchase Details
Closed on
Jun 13, 2007
Sold by
Jones Brock A
Bought by
Miller James L
Create a Home Valuation Report for This Property
The Home Valuation Report is an in-depth analysis detailing your home's value as well as a comparison with similar homes in the area
Purchase History
| Date | Buyer | Sale Price | Title Company |
|---|---|---|---|
| Bean David M | -- | Tusc Title | |
| Bean Michael J | -- | Tusc Title | |
| Bean Michael J | $18,500 | Tusc Title | |
| Thompson Michael E | $35,900 | Attorney | |
| J & R Signature Properties Llc | -- | Heartland Title | |
| Miller James L | $11,000 | Tusc Title |
Source: Public Records
Mortgage History
| Date | Status | Borrower | Loan Amount |
|---|---|---|---|
| Previous Owner | Thompson Michael E | $35,900 |
Source: Public Records
Tax History
| Year | Tax Paid | Tax Assessment Tax Assessment Total Assessment is a certain percentage of the fair market value that is determined by local assessors to be the total taxable value of land and additions on the property. | Land | Improvement |
|---|---|---|---|---|
| 2024 | $412 | $11,950 | $2,840 | $9,110 |
| 2023 | $412 | $34,140 | $8,100 | $26,040 |
| 2022 | $418 | $11,949 | $2,835 | $9,114 |
| 2021 | $323 | $8,666 | $2,128 | $6,538 |
| 2020 | $343 | $8,666 | $2,128 | $6,538 |
| 2019 | $329 | $8,666 | $2,128 | $6,538 |
| 2018 | $461 | $7,320 | $1,800 | $5,520 |
| 2017 | $295 | $7,320 | $1,800 | $5,520 |
| 2016 | $461 | $7,320 | $1,800 | $5,520 |
| 2014 | $266 | $6,270 | $1,890 | $4,380 |
| 2013 | $437 | $6,270 | $1,890 | $4,380 |
Source: Public Records
Map
Nearby Homes
- 0 Royal St
- 4711 Broadway
- 0 Vernon St Unit 5009296
- 0 Ford Dr
- 2216 Hilliard Dr
- 2215 Hilliard Dr
- 2933 Rabbit Dr
- 11638 3rd St
- 1573 Barnhill Rd SE
- 0 Indian Hill Rd SE Unit 5177729
- 3912 Clay Ct SE
- 112 Kutcham Dr
- 0 Canary Rd SE
- 5618 Green Ridge Rd SE
- 3183 Canary Rd SE
- 4091 Schumacher Hollow Rd SE
- 4095 Schumacher Hollow Rd SE
- 1107 Parrish St
- 911 N Water St
- 816 N 1st St
- 0 Stevenson Dr
- 2342 Royal St
- 9999 Stevenson Dr
- 4783 Rutledge St SE
- 2347 Royal St
- 4807 Rutledge St SE
- 4793 Rutledge St SE
- 4764 Rutledge St SE
- 3834 Stevenson Dr
- 4793 Rutledge St SE
- 4828 Rutledge St SE
- 4773 Rutledge St SE
- 3834 Stevenson Dr
- 2347 Royal St
- 4773 Rutledge St
- 4754 Rutledge St SE
- 2286 Royal St
- 2355 Royal St
- 4763 Rutledge St SE
- 3818 Stevenson Dr
Your Personal Tour Guide
Ask me questions while you tour the home.