
386 Commonwealth Ave Unit 51 Boston, MA 02215
Back Bay NeighborhoodHighlights
- Hardwood Floors
- Fireplace
- Smoke Free
- Deck
About This Home
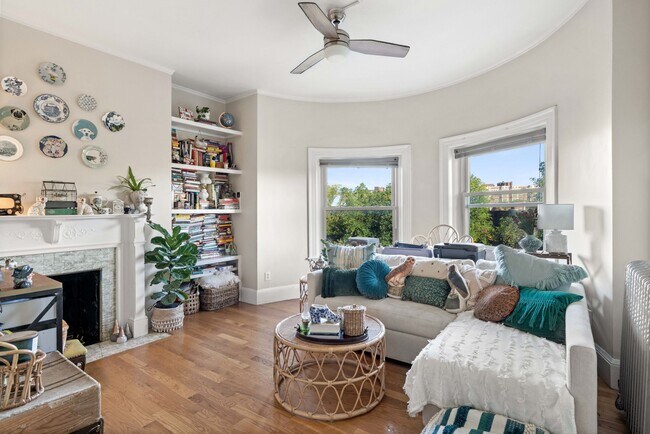
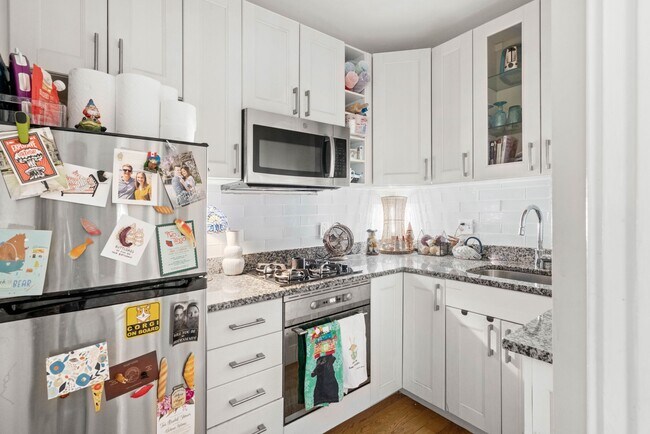
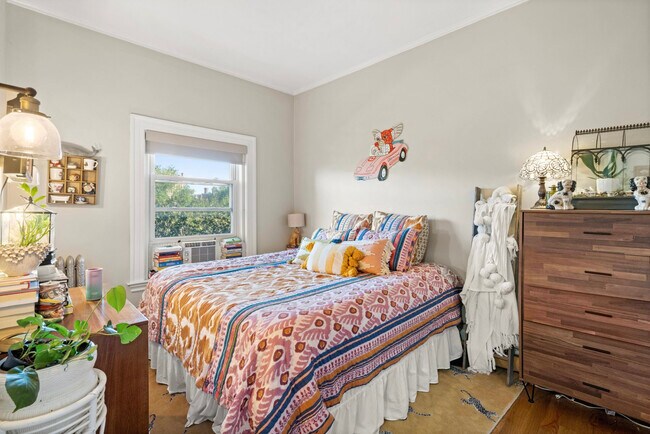
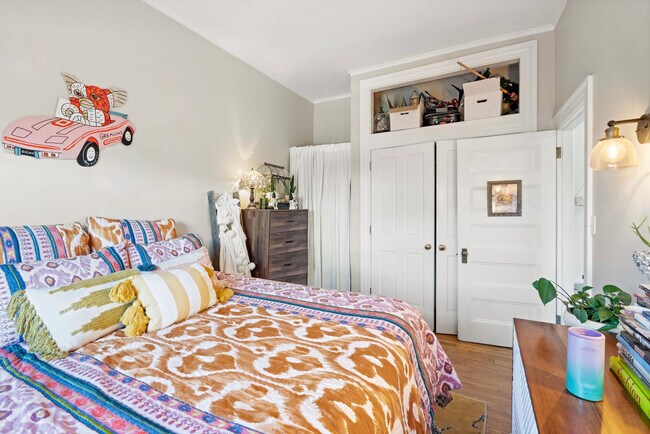
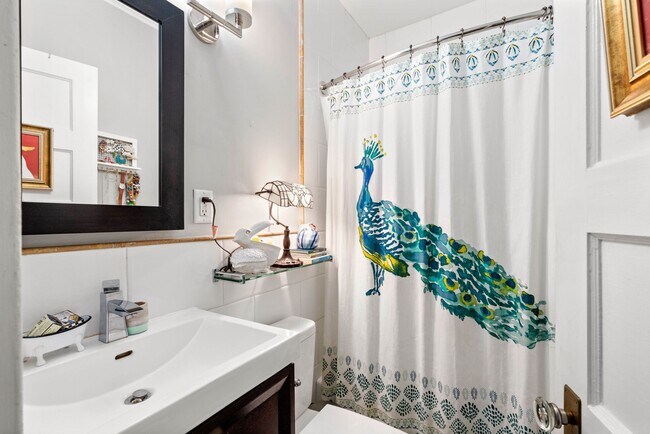
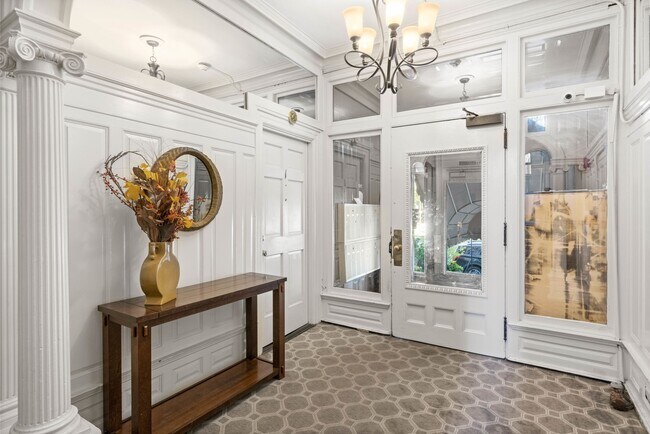
Situated on the quintessential tree-lined Commonwealth Avenue in the heart of the Back Bay, this 1-bedroom is located in a professionally managed elevator building. The living room has a large bay window with stunning views of the Commonwealth Avenue Mall, a decorative fireplace, and large floor-to-ceiling built-in shelves. The bedroom can easily fit a king-sized bed and has a spacious closet with an additional storage loft. The updated galley kitchen features stainless steel appliances and disposal. There are 9.5ft soaring ceilings throughout with ceiling fan in the living room. The building is completed with a common roof deck, laundry room, and bike storage. Rent includes heat, hot water, and trash removal.

Map
Property History
| Date | Event | Price | List to Sale | Price per Sq Ft |
|---|---|---|---|---|
| 07/14/2025 07/14/25 | Price Changed | $3,350 | 0.0% | $6 / Sq Ft |
| 07/14/2025 07/14/25 | For Rent | $3,350 | +1.7% | -- |
| 05/27/2025 05/27/25 | Off Market | $3,295 | -- | -- |
| 01/28/2025 01/28/25 | For Rent | $3,295 | 0.0% | -- |
| 10/05/2024 10/05/24 | For Rent | $3,295 | -0.2% | -- |
| 12/15/2023 12/15/23 | Rented | $3,300 | 0.0% | -- |
| 12/07/2023 12/07/23 | Under Contract | -- | -- | -- |
| 10/18/2023 10/18/23 | Price Changed | $3,300 | -2.9% | $7 / Sq Ft |
| 09/29/2023 09/29/23 | For Rent | $3,400 | +19.3% | -- |
| 11/05/2021 11/05/21 | Rented | -- | -- | -- |
| 10/22/2021 10/22/21 | Under Contract | -- | -- | -- |
| 10/15/2021 10/15/21 | For Rent | $2,850 | 0.0% | -- |
| 03/12/2019 03/12/19 | Rented | $2,850 | 0.0% | -- |
| 02/26/2019 02/26/19 | Price Changed | $2,850 | -5.0% | $6 / Sq Ft |
| 02/20/2019 02/20/19 | For Rent | $3,000 | -- | -- |
- 390 Commonwealth Ave Unit 210
- 382 Commonwealth Ave Unit 24
- 425 Newbury St Unit 181
- 425 Newbury St Unit Spot 179
- 425 Newbury St Unit 165
- 425 Newbury St Unit PS-218
- 425 Newbury St Unit F15
- 425 Newbury Ps 170
- 416 Commonwealth Ave Unit 301
- 397 Commonwealth Ave Unit PH
- 397 Commonwealth Ave Unit 2
- 395 Commonwealth Ave
- 377 Commonwealth Ave
- 413 Commonwealth Ave Unit 5
- 511 Beacon St Unit 11
- 362 Commonwealth Ave Unit 2E, 2F
- 362 Commonwealth Ave Unit 6D
- 362 Commonwealth Ave Unit 4E
- 4 Charlesgate E Unit 107
- 4 Charlesgate E Unit 703
- 386 Commonwealth Ave Unit 62
- 384 Commonwealth Ave Unit 22
- 384 Commonwealth Ave Unit 62
- 384 Commonwealth Ave Unit 51
- 384 Commonwealth Ave
- 388 Commonwealth Ave Unit 21
- 388 Commonwealth Ave Unit 9
- 390 Commonwealth Ave Unit 809
- 425 Newbury Street Parking Space Unit N58
- 370 Commonwealth Ave Unit 379-2
- 387 Commonwealth Ave
- 387 Commonwealth Ave
- 385 Commonwealth Ave
- 391 Commonwealth Ave Unit 4B
- 383 Commonwealth Ave
Ask me questions while you tour the home.