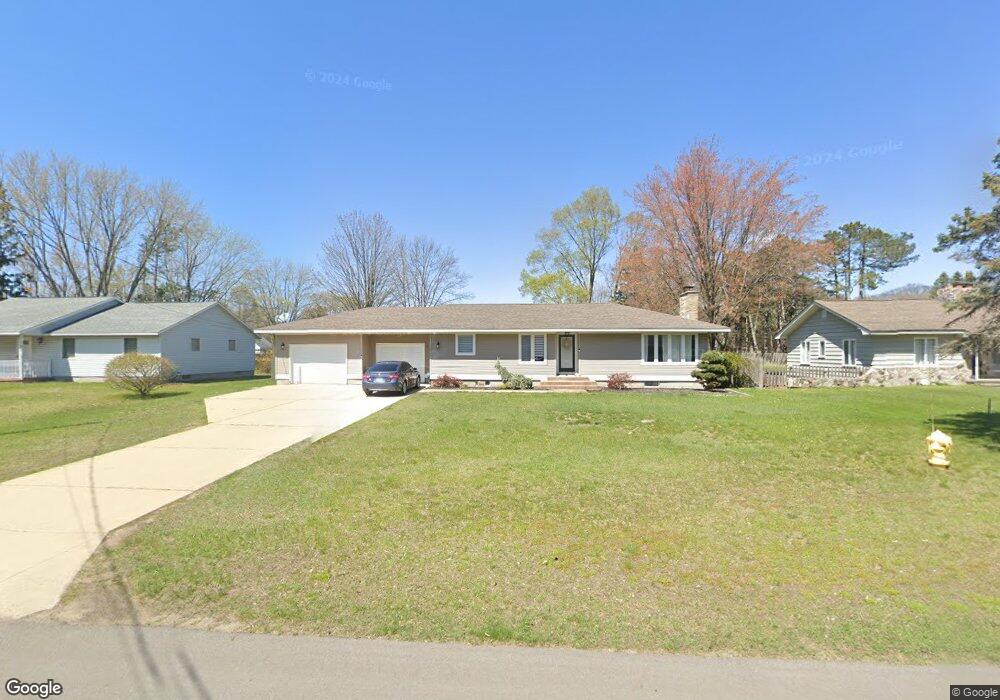
386 Eugene Ave Norton Shores, MI 49441
Estimated Value: $279,248 - $327,000
4
Beds
2
Baths
1,232
Sq Ft
$243/Sq Ft
Est. Value
About This Home
This home is located at 386 Eugene Ave, Norton Shores, MI 49441 and is currently estimated at $299,812, approximately $243 per square foot. 386 Eugene Ave is a home located in Muskegon County with nearby schools including Mona Shores High School, Michigan Dunes Montessori School, and West Shore Lutheran School.
Ownership History
Date
Name
Owned For
Owner Type
Purchase Details
Closed on
Nov 30, 2020
Sold by
Jensen Andrew
Bought by
Thompson Bailey L and Thompson Edward A
Current Estimated Value
Home Financials for this Owner
Home Financials are based on the most recent Mortgage that was taken out on this home.
Original Mortgage
$171,000
Outstanding Balance
$152,512
Interest Rate
2.8%
Mortgage Type
New Conventional
Estimated Equity
$147,300
Purchase Details
Closed on
Apr 27, 2015
Sold by
Deutsche Bank National Trust Company
Bought by
Tenbrink Family Trust
Purchase Details
Closed on
Jan 9, 2015
Sold by
Gallegos Richard E and Gallegos Renee M
Bought by
Deutsche Bank National Trust Company
Purchase Details
Closed on
May 13, 2005
Sold by
Meier Thomas D and Richardson Leon D
Bought by
Gallegos Richard E and Gallegos Renee M
Home Financials for this Owner
Home Financials are based on the most recent Mortgage that was taken out on this home.
Original Mortgage
$32,809
Interest Rate
6.07%
Mortgage Type
Stand Alone Second
Create a Home Valuation Report for This Property
The Home Valuation Report is an in-depth analysis detailing your home's value as well as a comparison with similar homes in the area
Home Values in the Area
Average Home Value in this Area
Purchase History
| Date | Buyer | Sale Price | Title Company |
|---|---|---|---|
| Thompson Bailey L | $180,000 | None Available | |
| Jensen Andrew | $75,000 | None Available | |
| Tenbrink Family Trust | $85,000 | Multiple | |
| Deutsche Bank National Trust Company | $129,423 | Rei | |
| Gallegos Richard E | $164,045 | Muskegon Land Title Agency L | |
| Meier Thomas D | $30,000 | Muskegon Land Title Agency L |
Source: Public Records
Mortgage History
| Date | Status | Borrower | Loan Amount |
|---|---|---|---|
| Open | Thompson Bailey L | $171,000 | |
| Previous Owner | Meier Thomas D | $32,809 | |
| Previous Owner | Gallegos Richard E | $131,236 |
Source: Public Records
Tax History Compared to Growth
Tax History
| Year | Tax Paid | Tax Assessment Tax Assessment Total Assessment is a certain percentage of the fair market value that is determined by local assessors to be the total taxable value of land and additions on the property. | Land | Improvement |
|---|---|---|---|---|
| 2025 | $3,461 | $113,600 | $0 | $0 |
| 2024 | $2,713 | $106,000 | $0 | $0 |
| 2023 | $2,591 | $90,900 | $0 | $0 |
| 2022 | $3,159 | $82,900 | $0 | $0 |
| 2021 | $3,069 | $76,300 | $0 | $0 |
| 2020 | $3,660 | $72,100 | $0 | $0 |
| 2019 | $3,593 | $65,600 | $0 | $0 |
| 2018 | $3,509 | $61,000 | $0 | $0 |
| 2017 | $3,430 | $59,600 | $0 | $0 |
| 2016 | $2,359 | $57,600 | $0 | $0 |
| 2015 | -- | $55,800 | $0 | $0 |
| 2014 | $1,941 | $53,200 | $0 | $0 |
| 2013 | -- | $50,300 | $0 | $0 |
Source: Public Records
Map
Nearby Homes
- 4676 Earl St
- 263 Churchill Dr
- 516 Hendrick Rd
- 243 Lake Dr
- 4655 Henry St
- 608 Porter Rd
- 5128 Henry St
- 4666 Heinicke St
- 740 Bridgeview Bay Dr
- 5473 Martin Rd
- 5579 Martin Rd
- 5153 Shady Creek Dr
- 481 Seminole Rd
- 6 Lakeview Ave
- 18 Lakeview Ave
- 10 Lakeview Ave
- 4085 Quainton Rd
- 5085 Gay St
- 4875 Paul Ct
- 3588 Mona Kai Blvd