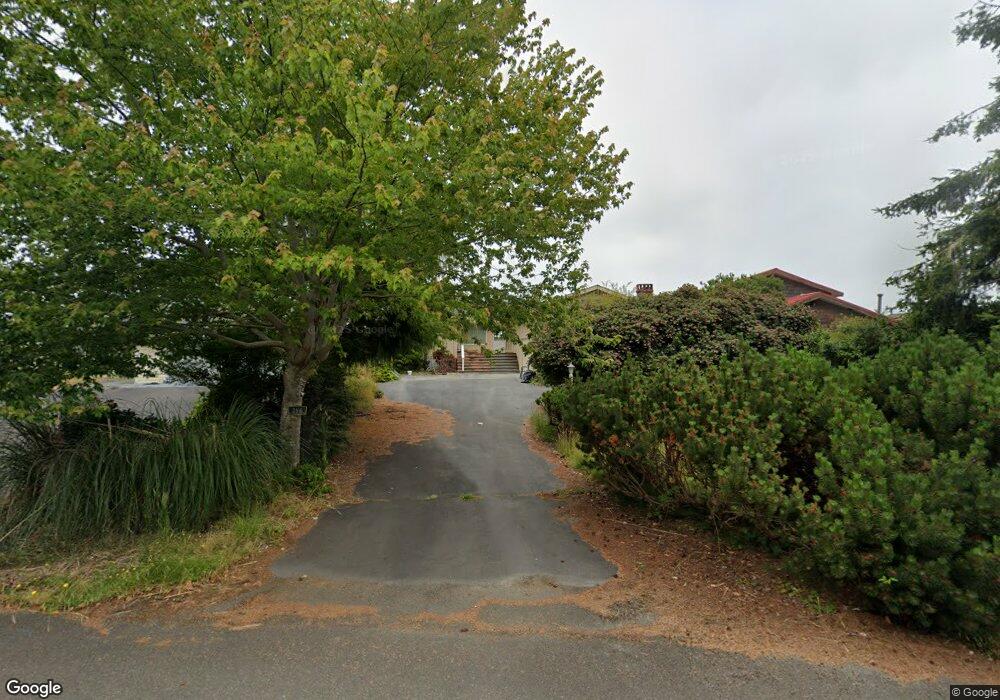
386 Harbor View Loop SE Ocean Shores, WA 98569
Estimated Value: $559,397 - $643,000
2
Beds
3
Baths
1,916
Sq Ft
$311/Sq Ft
Est. Value
About This Home
This home is located at 386 Harbor View Loop SE, Ocean Shores, WA 98569 and is currently estimated at $596,349, approximately $311 per square foot. 386 Harbor View Loop SE is a home located in Grays Harbor County with nearby schools including North Beach Junior/Senior High School.
Ownership History
Date
Name
Owned For
Owner Type
Purchase Details
Closed on
Oct 25, 2010
Sold by
Us Bank National Association
Bought by
Wu Dandong
Current Estimated Value
Home Financials for this Owner
Home Financials are based on the most recent Mortgage that was taken out on this home.
Original Mortgage
$175,200
Outstanding Balance
$114,945
Interest Rate
4.16%
Mortgage Type
New Conventional
Estimated Equity
$481,404
Purchase Details
Closed on
May 7, 2010
Sold by
Johnson Billy V
Bought by
Us Bank National Association
Create a Home Valuation Report for This Property
The Home Valuation Report is an in-depth analysis detailing your home's value as well as a comparison with similar homes in the area
Home Values in the Area
Average Home Value in this Area
Purchase History
| Date | Buyer | Sale Price | Title Company |
|---|---|---|---|
| Wu Dandong | $219,000 | Coast Title | |
| Us Bank National Association | $167,370 | Coast Title |
Source: Public Records
Mortgage History
| Date | Status | Borrower | Loan Amount |
|---|---|---|---|
| Open | Wu Dandong | $175,200 |
Source: Public Records
Tax History Compared to Growth
Tax History
| Year | Tax Paid | Tax Assessment Tax Assessment Total Assessment is a certain percentage of the fair market value that is determined by local assessors to be the total taxable value of land and additions on the property. | Land | Improvement |
|---|---|---|---|---|
| 2025 | $3,560 | $562,268 | $185,000 | $377,268 |
| 2023 | $3,534 | $557,319 | $170,000 | $387,319 |
| 2022 | $3,073 | $363,512 | $100,000 | $263,512 |
| 2021 | $3,361 | $363,512 | $100,000 | $263,512 |
| 2020 | $3,090 | $325,520 | $100,000 | $225,520 |
| 2019 | $2,945 | $287,933 | $100,000 | $187,933 |
| 2018 | $2,904 | $267,379 | $80,000 | $187,379 |
| 2017 | $2,568 | $249,191 | $80,000 | $169,191 |
| 2016 | $2,505 | $215,590 | $76,500 | $139,090 |
| 2014 | -- | $218,900 | $66,500 | $152,400 |
| 2013 | -- | $247,565 | $95,000 | $152,565 |
Source: Public Records
Map
Nearby Homes
- 347 Harbor View Loop SE
- 317 Captain Gray Ct SE
- 343 Duck Lake Dr SE
- 363 Eaglenest Ct SE
- 314 Harbor View Loop SE
- 385 Eaglenest Ct SE
- 311 Sycamore Ct
- 227 Sunrise Ave SE
- 222 Sunrise Ave SE
- 186 Murphy Ct
- 544 Mount Olympus Ave SE
- 579 Blue Wing Loop SE
- 181 Duck Lake Dr SE
- 510 Chickamin Ct SE
- 598 Blue Wing Loop SE
- 492 Quinault Ave SE
- 390 Mira Ct
- 407 Mount Olympus Ave SE
- 367 Eridani Loop SE
- 130 Sunrise Ave SE
- 384 Harbor View Loop SE
- 388 Harbor View Loop SE
- 380 Harbor View Loop SE
- 390 Harbor View Loop SE
- 391 Harbor View Loop SE
- 378 Harbor View Loop SE
- 394 Harbor View Loop SE
- 316 Oyster Ct SE
- 376 Harbor View Loop SE
- 395 Harbor View Loop SE
- 312 Oyster Ct SE
- 387 Taxus Ct SE
- 396 Harbor View Loop SE
- 308 Oyster Ct SE
- 375 Harbor View Loop SE
- 383 Taxus Ct SE
- 394 Duck Lake Dr SE
- 400 Duck Lake Dr SE
- 304 Oyster Ct SE
- 368 Harbor View Loop SE