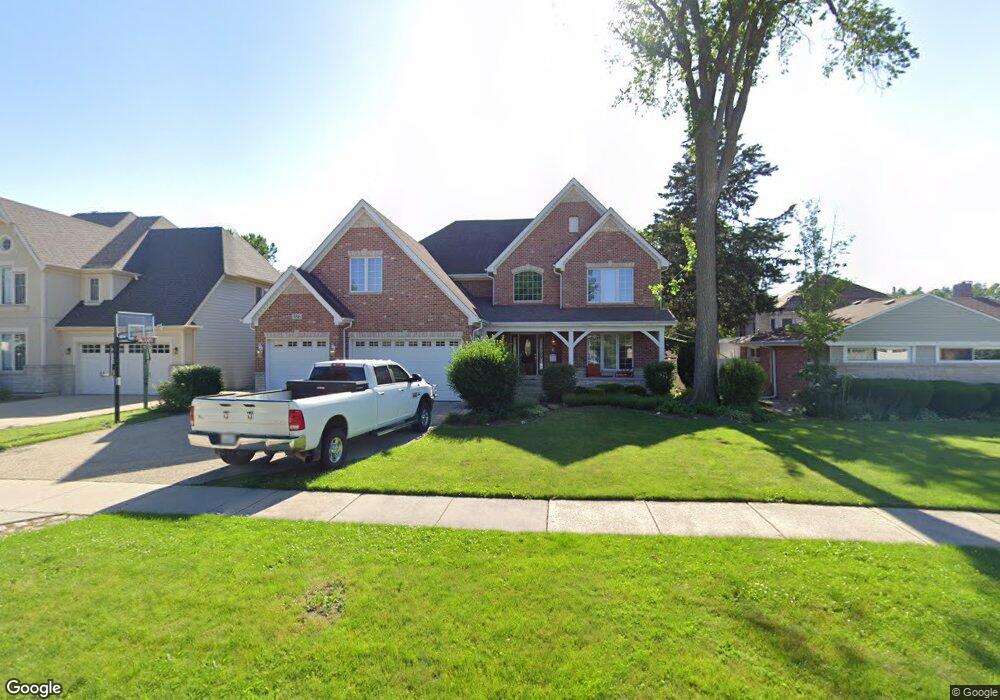
386 N Highview Ave Elmhurst, IL 60126
Estimated Value: $1,101,000 - $1,420,000
--
Bed
1
Bath
4,391
Sq Ft
$292/Sq Ft
Est. Value
About This Home
This home is located at 386 N Highview Ave, Elmhurst, IL 60126 and is currently estimated at $1,282,320, approximately $292 per square foot. 386 N Highview Ave is a home located in DuPage County with nearby schools including Emerson Elementary School, Churchville Middle School, and York Community High School.
Ownership History
Date
Name
Owned For
Owner Type
Purchase Details
Closed on
May 30, 2007
Sold by
Mcdaid Peter E
Bought by
Mcdaid Peter E and Mc Daid Mary
Current Estimated Value
Home Financials for this Owner
Home Financials are based on the most recent Mortgage that was taken out on this home.
Original Mortgage
$285,000
Interest Rate
6.2%
Mortgage Type
Stand Alone Refi Refinance Of Original Loan
Purchase Details
Closed on
Jul 12, 2000
Sold by
Leahy Daniel P and Leahy Jennifer A
Bought by
Mcdaid Peter E
Home Financials for this Owner
Home Financials are based on the most recent Mortgage that was taken out on this home.
Original Mortgage
$169,600
Interest Rate
8.19%
Purchase Details
Closed on
Apr 15, 1996
Sold by
Wheatland Jon A and Garrett Suzanne N
Bought by
Leahy Daniel P and Kuta Jennifer A
Home Financials for this Owner
Home Financials are based on the most recent Mortgage that was taken out on this home.
Original Mortgage
$113,600
Interest Rate
7.46%
Create a Home Valuation Report for This Property
The Home Valuation Report is an in-depth analysis detailing your home's value as well as a comparison with similar homes in the area
Home Values in the Area
Average Home Value in this Area
Purchase History
| Date | Buyer | Sale Price | Title Company |
|---|---|---|---|
| Mcdaid Peter E | -- | First American Title Ins Co | |
| Mcdaid Peter E | $212,000 | -- | |
| Leahy Daniel P | $142,000 | -- |
Source: Public Records
Mortgage History
| Date | Status | Borrower | Loan Amount |
|---|---|---|---|
| Closed | Mcdaid Peter E | $285,000 | |
| Closed | Mcdaid Peter E | $169,600 | |
| Previous Owner | Leahy Daniel P | $113,600 |
Source: Public Records
Tax History Compared to Growth
Tax History
| Year | Tax Paid | Tax Assessment Tax Assessment Total Assessment is a certain percentage of the fair market value that is determined by local assessors to be the total taxable value of land and additions on the property. | Land | Improvement |
|---|---|---|---|---|
| 2024 | $22,496 | $375,335 | $74,362 | $300,973 |
| 2023 | $20,801 | $345,040 | $68,360 | $276,680 |
| 2022 | $20,437 | $339,640 | $65,410 | $274,230 |
| 2021 | $19,586 | $325,320 | $62,650 | $262,670 |
| 2020 | $18,449 | $311,610 | $60,010 | $251,600 |
| 2019 | $18,280 | $299,620 | $57,700 | $241,920 |
| 2018 | $17,331 | $282,720 | $54,960 | $227,760 |
| 2017 | $17,016 | $270,210 | $52,530 | $217,680 |
| 2016 | $16,342 | $249,480 | $48,500 | $200,980 |
| 2015 | $16,064 | $230,460 | $44,800 | $185,660 |
| 2014 | $15,473 | $204,730 | $36,960 | $167,770 |
| 2013 | $15,396 | $208,900 | $37,710 | $171,190 |
Source: Public Records
Map
Nearby Homes
- 322 N Highland Ave
- 468 N Highland Ave
- 285 N Ridgeland Ave
- 284 N Highland Ave
- 261 N Highview Ave
- 196 N Walnut St
- 639 W Comstock Ave
- 656 W Comstock Ave
- 456 N Elm Ave
- 655 W Comstock Ave
- 251 W Armitage Ave
- 120 N Walnut St
- 355 W 1st St
- 104 Evergreen Ave
- 258 N Addison Ave
- 260 N Addison Ave
- 254 N Addison Ave
- 305 N Addison Ave
- 256 N Addison Ave
- 210 N Addison Ave Unit 202
- 384 N Highview Ave
- 394 N Highview Ave
- 380 N Highview Ave
- 380 N Highview Ave
- 458 W Fremont Ave
- 374 N Highview Ave
- 387 N Highview Ave
- 466 W Fremont Ave
- 385 N Oaklawn Ave
- 393 N Highview Ave
- 375 N Oaklawn Ave
- 375 N Oaklawn Ave Unit 2
- 375 N Highview Ave
- 381 N Oaklawn Ave
- 393 N Oaklawn Ave
- 371 N Oaklawn Ave
- 362 N Highview Ave
- 371 N Highview Ave
- 480 W Fremont Ave
- 455 W Fremont Ave