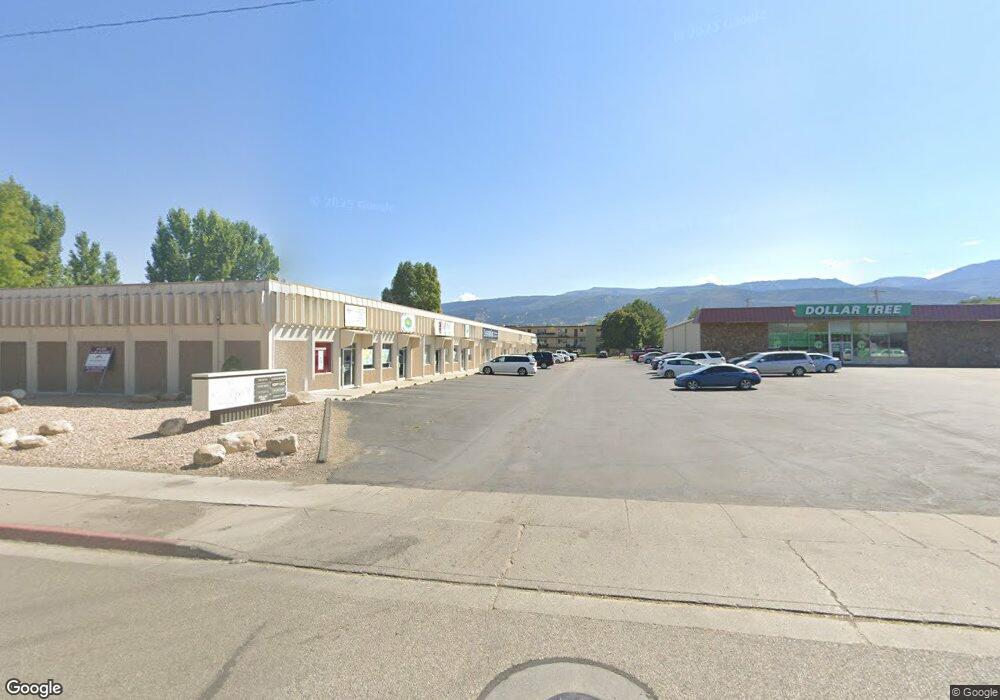
386 N Main St Ephraim, UT 84627
Estimated Value: $730,000
59
Beds
47
Baths
31,536
Sq Ft
$23/Sq Ft
Est. Value
About This Home
This home is located at 386 N Main St, Ephraim, UT 84627 and is currently priced at $730,000, approximately $23 per square foot. 386 N Main St is a home located in Sanpete County.
Ownership History
Date
Name
Owned For
Owner Type
Purchase Details
Closed on
Jul 1, 2025
Sold by
Acorn Oaktree Llc
Bought by
Tree House Capital Llc
Current Estimated Value
Home Financials for this Owner
Home Financials are based on the most recent Mortgage that was taken out on this home.
Original Mortgage
$1,075,000
Outstanding Balance
$1,073,183
Interest Rate
6.86%
Mortgage Type
Construction
Purchase Details
Closed on
Dec 30, 2009
Sold by
Ohman Jerald E and Ohman Marie
Bought by
Sessions Jeffrey Timothy
Create a Home Valuation Report for This Property
The Home Valuation Report is an in-depth analysis detailing your home's value as well as a comparison with similar homes in the area
Home Values in the Area
Average Home Value in this Area
Purchase History
| Date | Buyer | Sale Price | Title Company |
|---|---|---|---|
| Tree House Capital Llc | $1,343,750 | Juab Title & Abs Co | |
| Sessions Jeffrey Timothy | -- | -- |
Source: Public Records
Mortgage History
| Date | Status | Borrower | Loan Amount |
|---|---|---|---|
| Open | Tree House Capital Llc | $1,075,000 | |
| Closed | Tree House Capital Llc | $730,000 |
Source: Public Records
Tax History Compared to Growth
Tax History
| Year | Tax Paid | Tax Assessment Tax Assessment Total Assessment is a certain percentage of the fair market value that is determined by local assessors to be the total taxable value of land and additions on the property. | Land | Improvement |
|---|---|---|---|---|
| 2024 | $5,606 | $516,167 | $0 | $0 |
| 2023 | $5,530 | $484,663 | $0 | $0 |
| 2022 | $5,574 | $445,070 | $0 | $0 |
| 2021 | $5,379 | $371,202 | $0 | $0 |
| 2020 | $4,990 | $324,204 | $0 | $0 |
| 2019 | $4,703 | $300,678 | $0 | $0 |
| 2018 | $4,245 | $475,380 | $49,162 | $426,218 |
| 2017 | $3,237 | $208,744 | $0 | $0 |
| 2016 | $3,065 | $197,633 | $0 | $0 |
| 2015 | $3,079 | $197,633 | $0 | $0 |
| 2014 | $3,029 | $197,633 | $0 | $0 |
| 2013 | $3,015 | $197,633 | $0 | $0 |
Source: Public Records
Map
Nearby Homes