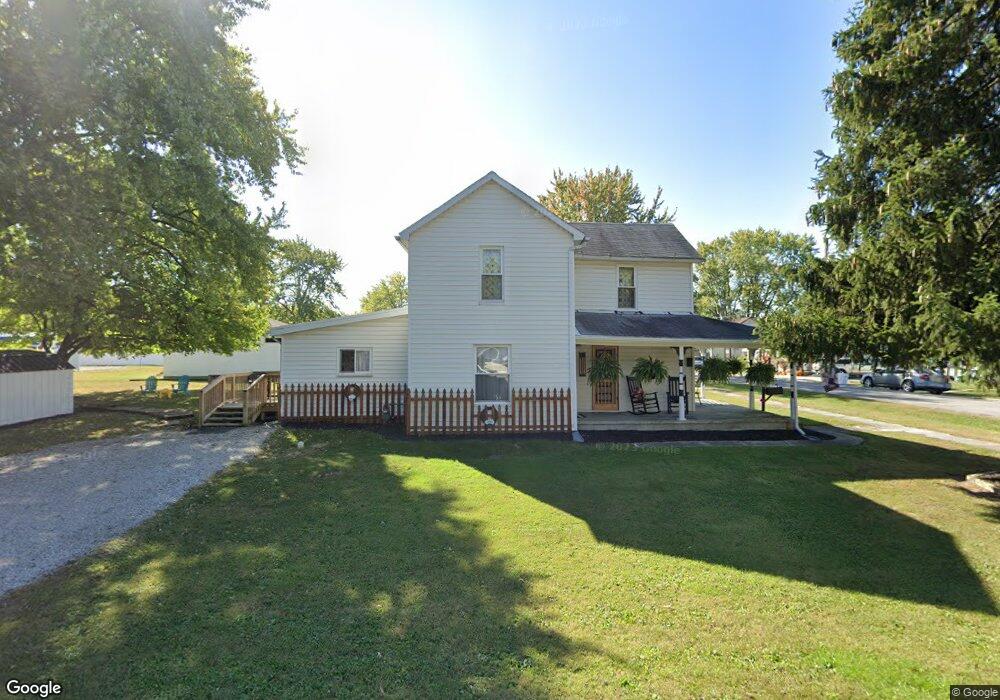
386 Nye St Marion, OH 43302
Estimated Value: $74,814 - $126,000
3
Beds
1
Bath
1,216
Sq Ft
$79/Sq Ft
Est. Value
About This Home
This home is located at 386 Nye St, Marion, OH 43302 and is currently estimated at $95,954, approximately $78 per square foot. 386 Nye St is a home located in Marion County with nearby schools including James A. Garfield Elementary School, Ulysses S. Grant Middle School, and Harding High School.
Ownership History
Date
Name
Owned For
Owner Type
Purchase Details
Closed on
Nov 30, 2023
Sold by
Simpkins Virginia A
Bought by
Knaul Brian Scott and Knaul Demerrill Beth
Current Estimated Value
Home Financials for this Owner
Home Financials are based on the most recent Mortgage that was taken out on this home.
Original Mortgage
$44,184
Outstanding Balance
$43,284
Interest Rate
7.63%
Mortgage Type
Credit Line Revolving
Estimated Equity
$52,670
Create a Home Valuation Report for This Property
The Home Valuation Report is an in-depth analysis detailing your home's value as well as a comparison with similar homes in the area
Home Values in the Area
Average Home Value in this Area
Purchase History
| Date | Buyer | Sale Price | Title Company |
|---|---|---|---|
| Knaul Brian Scott | $45,000 | None Listed On Document | |
| Knaul Brian Scott | $45,000 | None Listed On Document |
Source: Public Records
Mortgage History
| Date | Status | Borrower | Loan Amount |
|---|---|---|---|
| Open | Knaul Brian Scott | $44,184 | |
| Closed | Knaul Brian Scott | $44,184 |
Source: Public Records
Tax History
| Year | Tax Paid | Tax Assessment Tax Assessment Total Assessment is a certain percentage of the fair market value that is determined by local assessors to be the total taxable value of land and additions on the property. | Land | Improvement |
|---|---|---|---|---|
| 2025 | $673 | $25,610 | $1,640 | $23,970 |
| 2024 | $673 | $17,920 | $1,490 | $16,430 |
| 2023 | $673 | $17,920 | $1,490 | $16,430 |
| 2022 | $639 | $17,920 | $1,490 | $16,430 |
| 2021 | $638 | $16,110 | $1,300 | $14,810 |
| 2020 | $640 | $16,110 | $1,300 | $14,810 |
| 2019 | $639 | $16,110 | $1,300 | $14,810 |
| 2018 | $650 | $16,390 | $1,300 | $15,090 |
| 2017 | $659 | $16,390 | $1,300 | $15,090 |
| 2016 | $654 | $16,390 | $1,300 | $15,090 |
| 2015 | $654 | $16,020 | $1,230 | $14,790 |
| 2014 | $655 | $16,020 | $1,230 | $14,790 |
| 2012 | $706 | $17,170 | $1,730 | $15,440 |
Source: Public Records
Map
Nearby Homes
Your Personal Tour Guide
Ask me questions while you tour the home.