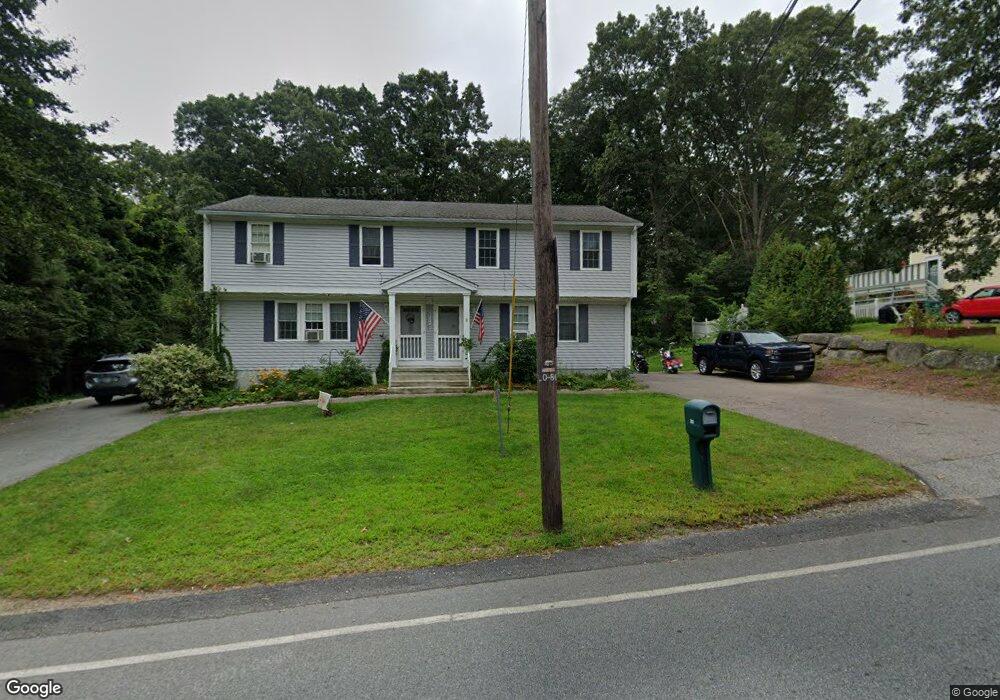
386 Rhodes Ave Unit 1 Woonsocket, RI 02895
Fairmount NeighborhoodEstimated Value: $504,331 - $583,000
3
Beds
2
Baths
1,274
Sq Ft
$432/Sq Ft
Est. Value
About This Home
This home is located at 386 Rhodes Ave Unit 1, Woonsocket, RI 02895 and is currently estimated at $550,083, approximately $431 per square foot. 386 Rhodes Ave Unit 1 is a home located in Providence County with nearby schools including Woonsocket High School, Rise Prep Mayoral Academy Middle School, and Rise Prep Mayoral Academy.
Ownership History
Date
Name
Owned For
Owner Type
Purchase Details
Closed on
Jun 3, 2016
Sold by
Jolicoeur Normand and Jolicoeur Barbara
Bought by
Uralowich Robin and Uralowich Brittany L
Current Estimated Value
Home Financials for this Owner
Home Financials are based on the most recent Mortgage that was taken out on this home.
Original Mortgage
$240,562
Outstanding Balance
$189,144
Interest Rate
3.37%
Mortgage Type
FHA
Estimated Equity
$360,939
Purchase Details
Closed on
Mar 13, 2012
Sold by
Jolicoeur Normand
Bought by
Jolicoeur Normand and Jolicoeur Barbara
Purchase Details
Closed on
Feb 19, 2008
Sold by
Bank Of New York
Bought by
Jolicoeur Normund
Create a Home Valuation Report for This Property
The Home Valuation Report is an in-depth analysis detailing your home's value as well as a comparison with similar homes in the area
Home Values in the Area
Average Home Value in this Area
Purchase History
| Date | Buyer | Sale Price | Title Company |
|---|---|---|---|
| Uralowich Robin | $245,000 | -- | |
| Uralowich Robin | $245,000 | -- | |
| Jolicoeur Normand | -- | -- | |
| Jolicoeur Normand | -- | -- | |
| Jolicoeur Normund | $226,500 | -- | |
| Jolicoeur Normund | $226,500 | -- |
Source: Public Records
Mortgage History
| Date | Status | Borrower | Loan Amount |
|---|---|---|---|
| Open | Uralowich Robin | $240,562 | |
| Closed | Jolicoeur Normund | $240,562 |
Source: Public Records
Tax History Compared to Growth
Tax History
| Year | Tax Paid | Tax Assessment Tax Assessment Total Assessment is a certain percentage of the fair market value that is determined by local assessors to be the total taxable value of land and additions on the property. | Land | Improvement |
|---|---|---|---|---|
| 2025 | $5,919 | $527,100 | $129,300 | $397,800 |
| 2024 | $5,688 | $391,200 | $122,800 | $268,400 |
| 2023 | $5,469 | $391,200 | $122,800 | $268,400 |
| 2022 | $5,469 | $391,200 | $122,800 | $268,400 |
| 2021 | $5,028 | $211,700 | $85,100 | $126,600 |
| 2020 | $5,081 | $211,700 | $85,100 | $126,600 |
| 2018 | $5,098 | $211,700 | $85,100 | $126,600 |
| 2017 | $6,050 | $201,000 | $72,300 | $128,700 |
| 2016 | $6,400 | $201,000 | $72,300 | $128,700 |
| 2015 | $7,353 | $201,000 | $72,300 | $128,700 |
| 2014 | $7,353 | $204,600 | $79,600 | $125,000 |
Source: Public Records
Map
Nearby Homes
- 386 Rhodes Ave
- 388 Rhodes Ave Unit 2
- 408 Rhodes Ave Unit 410
- 28 Steve Lopes Way
- 405 Rhodes Ave
- 34 Steve Lopes Way
- 359 Rhodes Ave
- 11 Comstock Ct
- 12 Comstock Ct
- 48 Steve Lopes Way
- 54 Steve Lopes Way
- 427 Rhodes Ave
- 104 Steve Lopes Way
- 100 Steve Lopes Way
- 78 Steve Lopes Way
- 15 Comstock Ct
- 334 Rhodes Ave
- 450 Rhodes Ave
- 84 Steve Lopes Way
- 328 Rhodes Ave