Estimated Value: $389,159 - $444,000
3
Beds
2
Baths
1,350
Sq Ft
$304/Sq Ft
Est. Value
About This Home
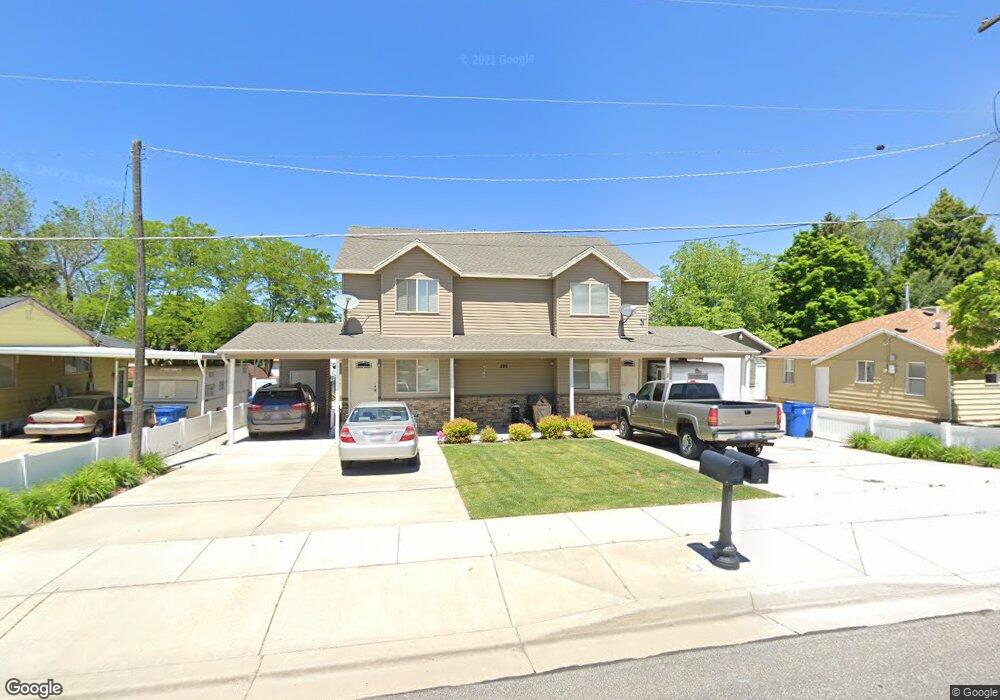
This home is located at 386 W 5000 S Unit A, Ogden, UT 84405 and is currently estimated at $410,790, approximately $304 per square foot. 386 W 5000 S Unit A is a home located in Weber County with nearby schools including Roosevelt School, T.H. Bell Junior High School, and Bonneville High School.
Ownership History
Date
Name
Owned For
Owner Type
Purchase Details
Closed on
Nov 15, 2010
Sold by
Parkinson Randall L
Bought by
Randall L Parkinson Llc
Current Estimated Value
Purchase Details
Closed on
Nov 3, 2009
Sold by
Garfield Brad H
Bought by
Parkinson Randall L
Purchase Details
Closed on
Sep 28, 2005
Sold by
Carrillo Max
Bought by
Garfield Brad H
Home Financials for this Owner
Home Financials are based on the most recent Mortgage that was taken out on this home.
Original Mortgage
$30,686
Interest Rate
5.9%
Mortgage Type
Purchase Money Mortgage
Create a Home Valuation Report for This Property
The Home Valuation Report is an in-depth analysis detailing your home's value as well as a comparison with similar homes in the area
Home Values in the Area
Average Home Value in this Area
Purchase History
| Date | Buyer | Sale Price | Title Company |
|---|---|---|---|
| Randall L Parkinson Llc | -- | None Available | |
| Parkinson Randall L | -- | American Secure Title Brigha | |
| Garfield Brad H | -- | First American Title |
Source: Public Records
Mortgage History
| Date | Status | Borrower | Loan Amount |
|---|---|---|---|
| Previous Owner | Garfield Brad H | $30,686 |
Source: Public Records
Tax History Compared to Growth
Tax History
| Year | Tax Paid | Tax Assessment Tax Assessment Total Assessment is a certain percentage of the fair market value that is determined by local assessors to be the total taxable value of land and additions on the property. | Land | Improvement |
|---|---|---|---|---|
| 2025 | $2,296 | $355,833 | $94,632 | $261,201 |
| 2024 | $2,296 | $347,000 | $94,632 | $252,368 |
| 2023 | $2,167 | $326,000 | $99,122 | $226,878 |
| 2022 | $2,439 | $386,000 | $94,317 | $291,683 |
| 2021 | $2,016 | $285,000 | $46,770 | $238,230 |
| 2020 | $1,937 | $250,000 | $38,128 | $211,872 |
| 2019 | $1,841 | $219,000 | $38,128 | $180,872 |
| 2018 | $1,604 | $185,000 | $38,128 | $146,872 |
| 2017 | $1,508 | $162,000 | $27,656 | $134,344 |
| 2016 | $1,444 | $84,778 | $15,550 | $69,228 |
| 2015 | $1,147 | $62,798 | $15,550 | $47,248 |
| 2014 | $1,147 | $62,575 | $15,550 | $47,025 |
Source: Public Records
Map
Nearby Homes