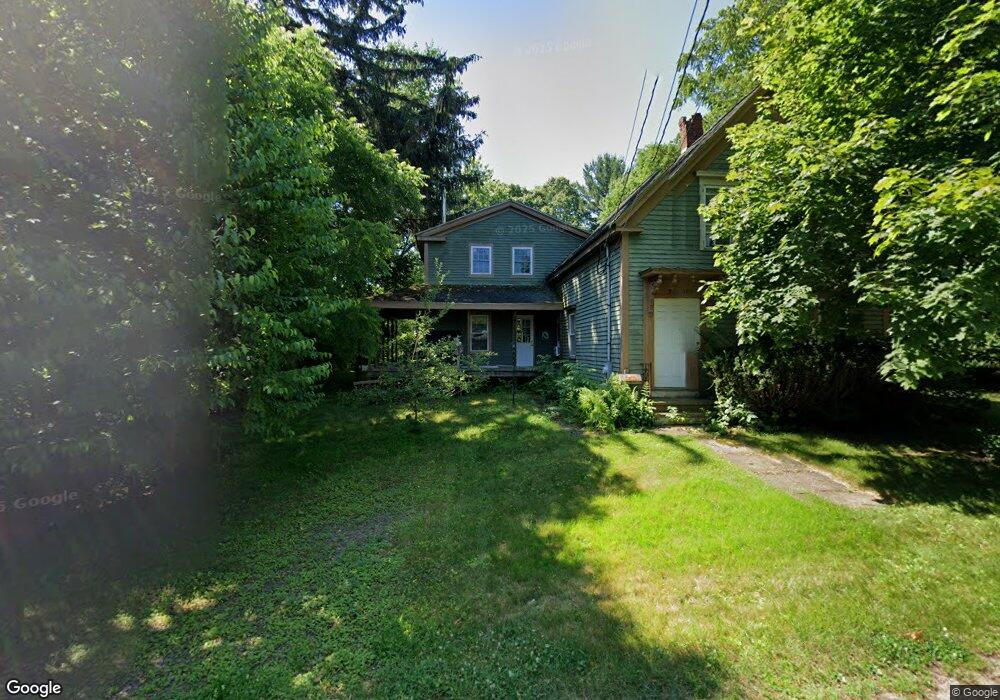
386 W Union St East Bridgewater, MA 02333
Estimated Value: $481,000 - $630,000
--
Bed
1
Bath
2,125
Sq Ft
$263/Sq Ft
Est. Value
About This Home
This home is located at 386 W Union St, East Bridgewater, MA 02333 and is currently estimated at $559,728, approximately $263 per square foot. 386 W Union St is a home located in Plymouth County with nearby schools including Central Elementary School, Gordon W Mitchell Middle School, and East Bridgewater Jr./Sr. High School.
Ownership History
Date
Name
Owned For
Owner Type
Purchase Details
Closed on
May 16, 1997
Sold by
Old Fall Rier Rd T
Bought by
Mcgowan Shawn
Current Estimated Value
Purchase Details
Closed on
Sep 21, 1995
Sold by
Ellis Tr Henry C and Cruz Edward F
Bought by
Old Fall River Rd T
Create a Home Valuation Report for This Property
The Home Valuation Report is an in-depth analysis detailing your home's value as well as a comparison with similar homes in the area
Home Values in the Area
Average Home Value in this Area
Purchase History
| Date | Buyer | Sale Price | Title Company |
|---|---|---|---|
| Mcgowan Shawn | $95,000 | -- | |
| Old Fall River Rd T | $10,000 | -- |
Source: Public Records
Mortgage History
| Date | Status | Borrower | Loan Amount |
|---|---|---|---|
| Open | Old Fall River Rd T | $145,283 | |
| Closed | Old Fall River Rd T | $140,000 | |
| Closed | Old Fall River Rd T | $140,000 |
Source: Public Records
Tax History Compared to Growth
Tax History
| Year | Tax Paid | Tax Assessment Tax Assessment Total Assessment is a certain percentage of the fair market value that is determined by local assessors to be the total taxable value of land and additions on the property. | Land | Improvement |
|---|---|---|---|---|
| 2025 | $6,173 | $451,600 | $186,100 | $265,500 |
| 2024 | $6,077 | $439,100 | $179,000 | $260,100 |
| 2023 | $5,885 | $407,300 | $179,000 | $228,300 |
| 2022 | $5,958 | $381,900 | $162,800 | $219,100 |
| 2021 | $5,961 | $349,600 | $156,400 | $193,200 |
| 2020 | $5,977 | $345,700 | $150,400 | $195,300 |
| 2019 | $5,758 | $327,900 | $143,800 | $184,100 |
| 2018 | $5,681 | $316,300 | $143,800 | $172,500 |
| 2017 | $5,563 | $304,000 | $137,100 | $166,900 |
| 2016 | $5,452 | $300,200 | $137,100 | $163,100 |
| 2015 | $5,301 | $298,500 | $136,200 | $162,300 |
| 2014 | $5,091 | $293,100 | $133,300 | $159,800 |
Source: Public Records
Map
Nearby Homes