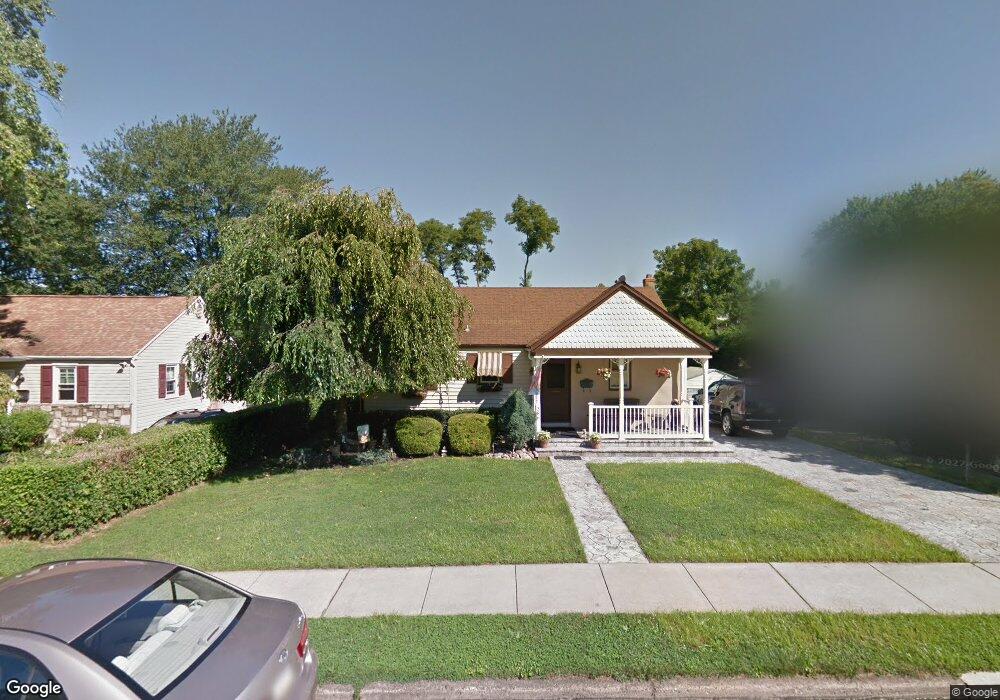
386 Walker Ave Langhorne, PA 19047
Estimated Value: $360,000 - $412,000
2
Beds
1
Bath
1,443
Sq Ft
$263/Sq Ft
Est. Value
About This Home
This home is located at 386 Walker Ave, Langhorne, PA 19047 and is currently estimated at $379,529, approximately $263 per square foot. 386 Walker Ave is a home located in Bucks County with nearby schools including Hoover Elementary School, Maple Point Middle School, and Neshaminy High School.
Ownership History
Date
Name
Owned For
Owner Type
Purchase Details
Closed on
Jun 6, 2025
Sold by
Birkhead Jessie Susan
Bought by
Christiansen Rachel
Current Estimated Value
Home Financials for this Owner
Home Financials are based on the most recent Mortgage that was taken out on this home.
Original Mortgage
$17,937
Outstanding Balance
$12,661
Interest Rate
6.76%
Mortgage Type
New Conventional
Estimated Equity
$366,868
Purchase Details
Closed on
Apr 16, 2003
Sold by
Birkhead Harold J
Bought by
Birkhead Harold J and Birkhead Jessie Susan
Home Financials for this Owner
Home Financials are based on the most recent Mortgage that was taken out on this home.
Original Mortgage
$147,500
Interest Rate
5.13%
Mortgage Type
Purchase Money Mortgage
Purchase Details
Closed on
Feb 13, 1992
Bought by
Birkhead Harold J
Create a Home Valuation Report for This Property
The Home Valuation Report is an in-depth analysis detailing your home's value as well as a comparison with similar homes in the area
Home Values in the Area
Average Home Value in this Area
Purchase History
| Date | Buyer | Sale Price | Title Company |
|---|---|---|---|
| Christiansen Rachel | $358,750 | Title Services | |
| Birkhead Harold J | -- | -- | |
| Birkhead Harold J | $10,000 | -- |
Source: Public Records
Mortgage History
| Date | Status | Borrower | Loan Amount |
|---|---|---|---|
| Open | Christiansen Rachel | $17,937 | |
| Open | Christiansen Rachel | $340,813 | |
| Previous Owner | Birkhead Harold J | $147,500 |
Source: Public Records
Tax History
| Year | Tax Paid | Tax Assessment Tax Assessment Total Assessment is a certain percentage of the fair market value that is determined by local assessors to be the total taxable value of land and additions on the property. | Land | Improvement |
|---|---|---|---|---|
| 2025 | $4,946 | $22,130 | $3,840 | $18,290 |
| 2024 | $4,946 | $22,130 | $3,840 | $18,290 |
| 2023 | $4,901 | $22,130 | $3,840 | $18,290 |
| 2022 | $4,777 | $22,130 | $3,840 | $18,290 |
| 2021 | $4,843 | $22,130 | $3,840 | $18,290 |
| 2020 | $4,854 | $22,130 | $3,840 | $18,290 |
| 2019 | $4,752 | $22,130 | $3,840 | $18,290 |
| 2018 | $4,659 | $22,130 | $3,840 | $18,290 |
| 2017 | $4,307 | $20,960 | $3,840 | $17,120 |
| 2016 | $4,235 | $20,960 | $3,840 | $17,120 |
| 2015 | -- | $20,960 | $3,840 | $17,120 |
| 2014 | -- | $20,960 | $3,840 | $17,120 |
Source: Public Records
Map
Nearby Homes
- 786 E Parker St Unit C1
- 732 Sparrow Ln
- 56 W Lincoln Hwy
- 937 Highpointe Cir
- 866 Hulmeville Rd
- 827 Hulmeville Rd
- 41 Pleasant Ave
- 711 Bellevue Ave
- 428 Madison Ave
- 956 Duxbury Dr
- 2823 Avenue E
- 858 Avenue E Unit E
- 3225 Ethan Allen Ct
- 0 Prospect Ave
- 6301 Powder Horn Ct
- 0 Fir Ave
- 1420 Super Hwy
- 0 Highland Ave E Unit PABU2111912
- 0 Highland Ave E Unit PABU2111920
- 706 Fox Ct
- 378 Walker Ave
- 394 Walker Ave
- 406 Walker Ave
- 370 Walker Ave
- 389 W Lincoln Hwy
- 414 Walker Ave
- 362 Walker Ave
- 391 Walker Ave
- 383 Walker Ave
- 401 Walker Ave
- 373 Walker Ave
- 401 W Lincoln Hwy
- 139 Glen Ave
- 341 W Lincoln Hwy
- 409 Walker Ave
- 365 Walker Ave
- 354 Walker Ave
- 325 W Lincoln Hwy
- 123 Glen Ave
- 419 Walker Ave
Your Personal Tour Guide
Ask me questions while you tour the home.